The power grid - a complex interplay of generation, consumption, trading and renewables.
The power grid in Europe, as a complex system with a large number of consumers and a wide variety of power plants, is subject to short-term, systematic fluctuations. Strong systematic frequency fluctuations often coincide with the transition of successive standardized trading products.
However, the following can be observed:
The feed-in priority of wind and PV has a dampening effect on the frequency deviation and stabilizes the overall system in times of particularly strong frequency deviations caused by trading transactions.
But in detail - for the stability of the European UCTE interconnected grid, frequency maintenance is indispensable. The grid frequency is the central measure of the balance between generation and consumption of electrical energy in the power grid. If an imbalance occurs, for example, the grid frequency in the entire power grid would fall if consumption exceeded generation. Likewise in the opposite case, the frequency in the entire interconnected grid would increase if there is an oversupply of electrical energy in the grid.
On the generation side, various control mechanisms are available to keep the frequency always close to the 50 Hz. If there are major deviations outside the controller deadband (50 Hz +/- 10 mHz), active readjustment is required through the use of primary, secondary control power, or even minute reserve. Examples of significant frequency deviations e.g. in January 2019 can be found here on gridradar.net.
There are a variety of (putative) impact factors that have an influence on frequency holding in the power grid (the list does not claim to be exhaustive)
- Power trading (e.g. transfer of generation from power plant A -> power plant B) cross-border power flows (mostly trade-related)
- major events (e.g., World Cup soccer)
- Forecast errors (Consumption behavior deviating from forecast, e.g., sudden cold snap)
- Generator or consumer outages
- Stochastic behavior of large number of consumers.
Strong systematic frequency fluctuations often coincide with the transition of successive (standardized) trading products. The suggestion that frequency fluctuations may be due to the transition of trading product delivery periods is further supported by an analysis of the feed-in effects of non-dispatchable renewables: Wind and PV have a dampening effect on frequency deviation and stabilize the overall system during periods of particularly large trading-induced frequency deviations.
In principle, it is to be expected that fluctuations should not be based on any systematics. However, contrary to this expectation, short-term systematic deviations can be identified, especially at hourly, quarterly and daily changes. For example, the frequency changes by about 37mHz on average at hourly changes (statistically significantly negative).
A probable driver of these systematic frequency deviations could be the change between delivery times of successive trade products.
If this conjecture is correct, then generators that feed into the grid independently of defined wholesale products should not result in these trading-related frequency effects. PV feed-ins in particular follow the principle of priority feed-in in Germany and are therefore largely offered independently of delivery terms of traded products.
The analysis shows that a higher share of fluctuating renewables in the total power has not only a neutral, but even a dampening effect on the frequency deviation to the transition of two consecutive delivery periods.
Contrary to the still prevailing popular belief, this article shows that fluctuating renewables have a system-stabilizing effect on grid frequency under the regime of priority feed-in.
The underlying data
Since summer 2017, MagnaGen GmbH has been setting up a Europe-wide system of stations for frequency measurement in the interconnected grid as part of the gridradar.net project. The measuring stations record the frequency and the phase angle in 1/10 s intervals. For the following analysis, data from a measuring station in southern Germany are used. For further analysis of the influence of different types of generation on the grid frequency, the generation data of the SMARD database of the Federal Network Agency are used. Both data sets are linked and evaluated for the period 01 August 2017 to 31 March 2018.
How are the data evaluated?
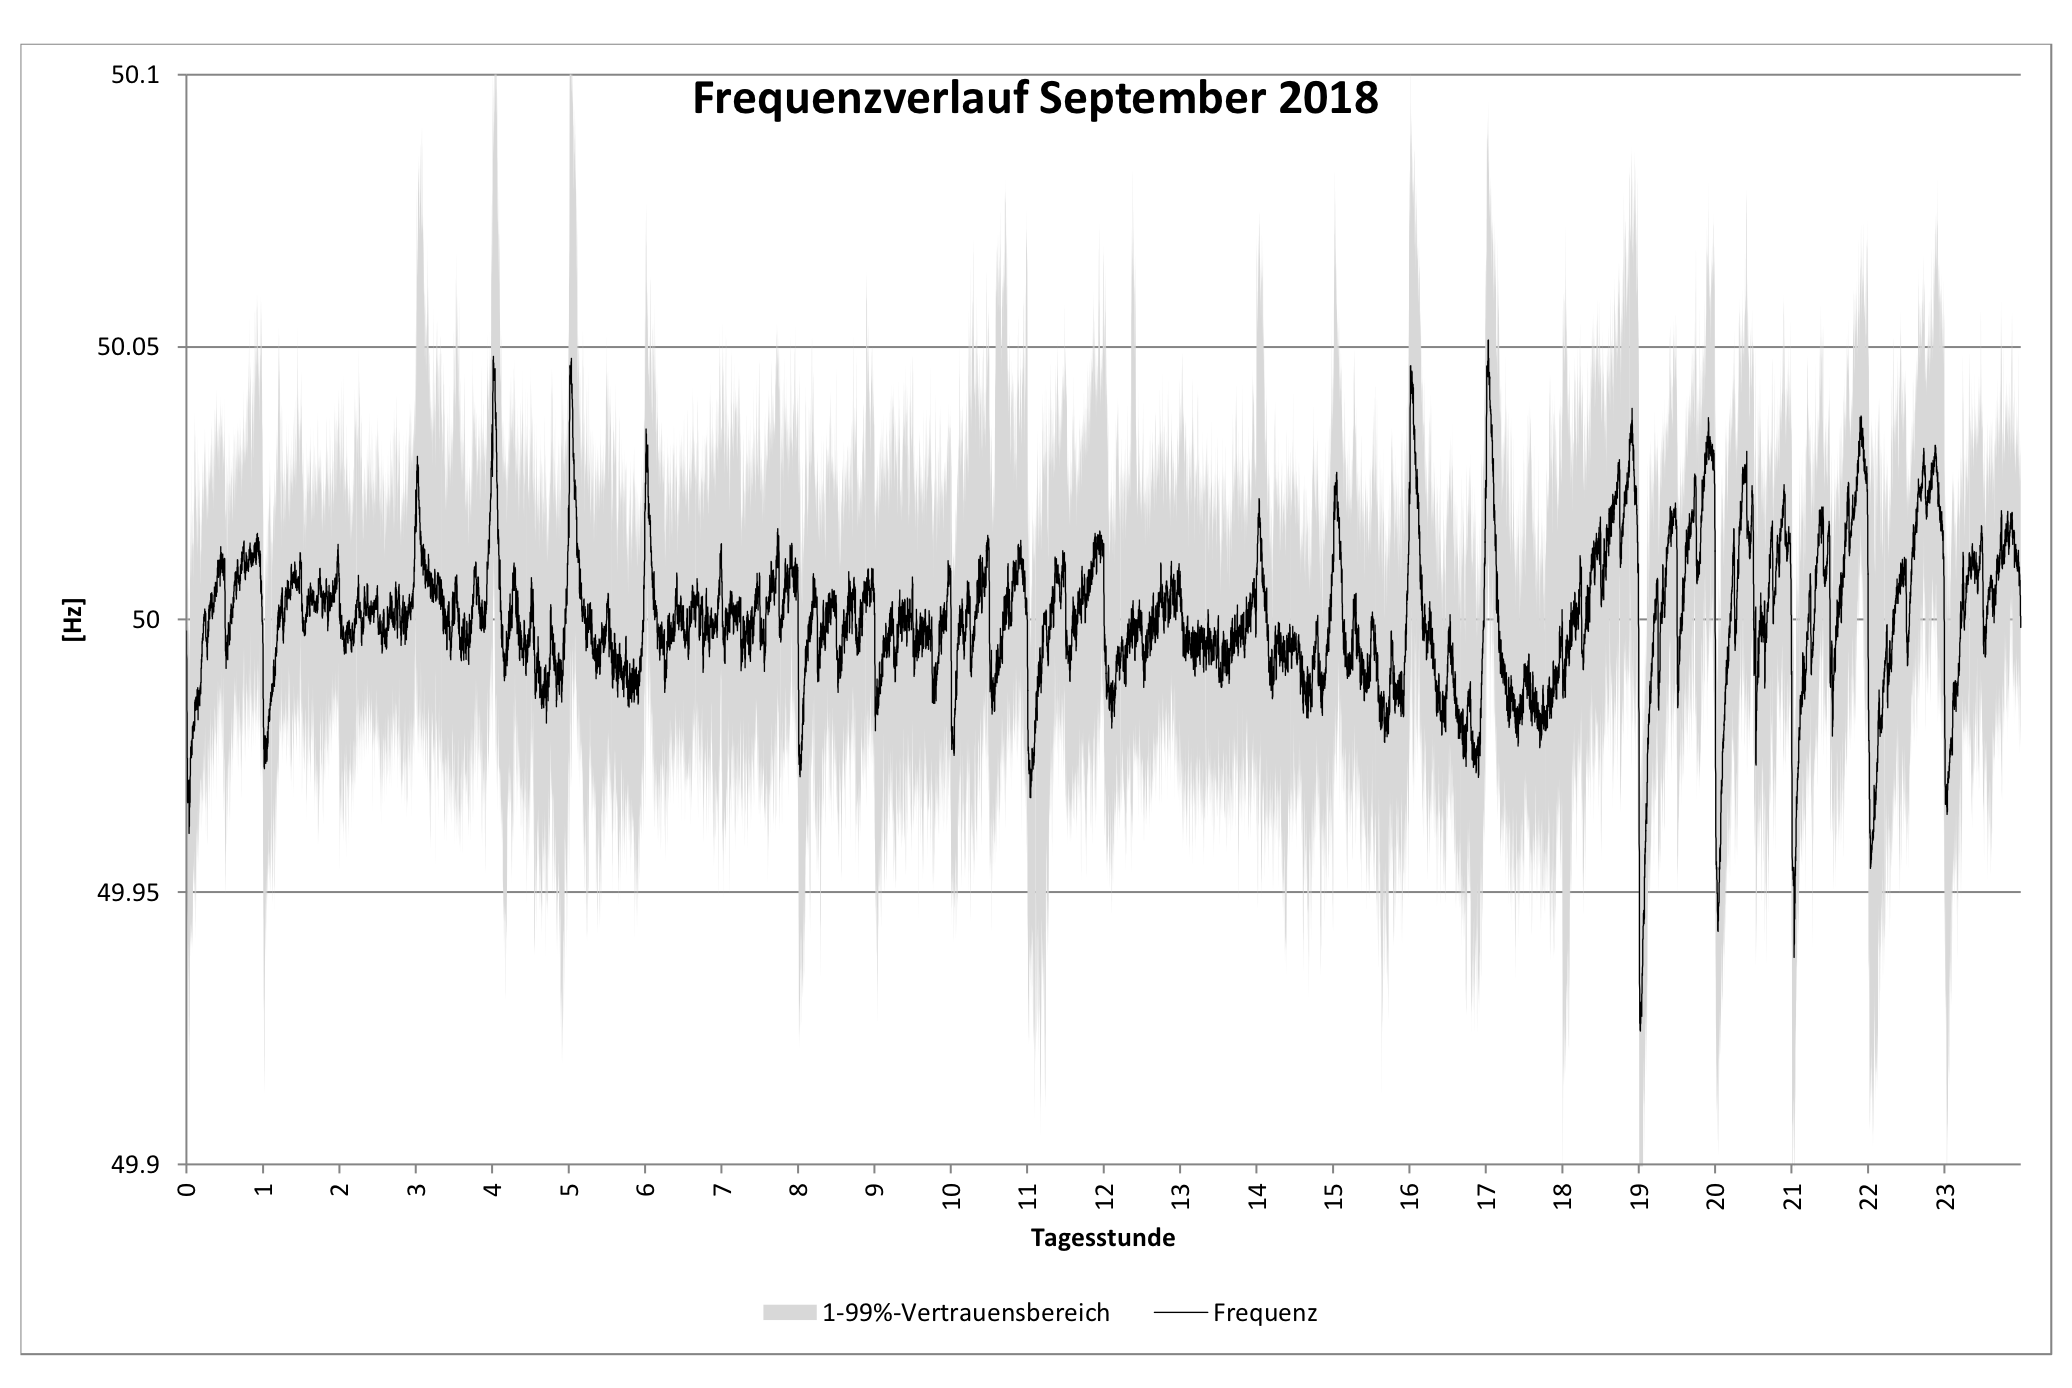
The frequency is close to 50Hz (49.9996Hz) on average for the period under consideration, but also includes the systematic underfrequency in the first quarter of 2018 (due to an undersupply).
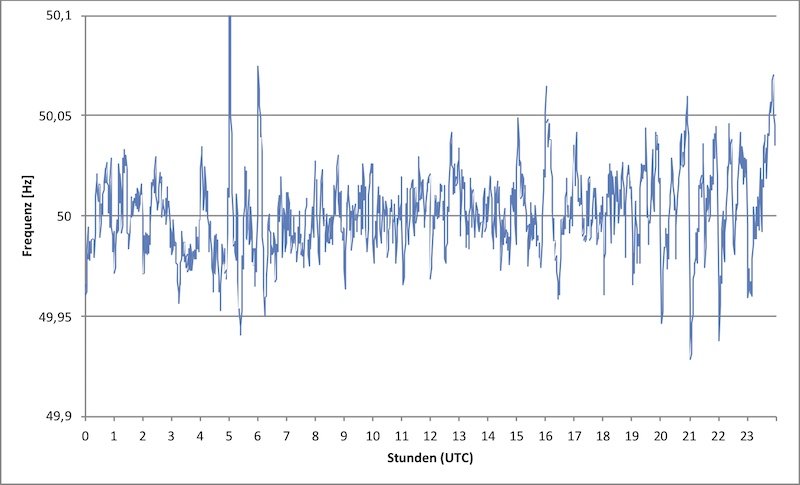 The figure shows an example of the frequency response on Wednesday of the third week in January - Jan. 17, 2018.
The frequency response over the day with regular strong deviations from the target frequency to the hourly breaks and weaker deviations within the hours is representative for the period under consideration. Striking are the strong deviations in the early morning hours and the evening hours. In the early morning hours, the deviations are upward, i.e., there are increases in frequency. In the evening hours they are directed downwards, i.e. there are frequency decreases due to short-term feed-in shortfalls.
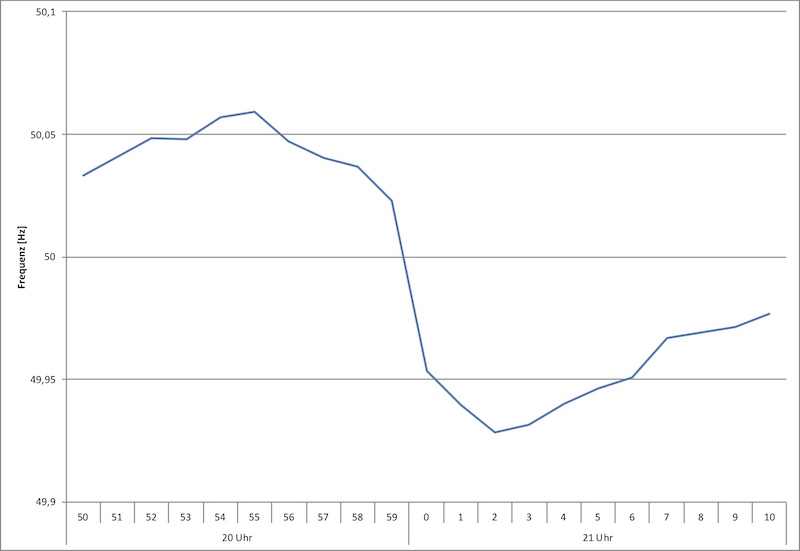
To better understand the progression around the hour change, this figure shows the frequency progression at 21:00 as an example. Before the hour change, the frequency runs at a constant level until two or three minutes before the hour change. Afterwards, the frequency usually falls until about two to three minutes after the hour change, before it rises again. This pattern is repeated every hour. It is irrelevant here whether the frequency before the hour break is above the target frequency of 50Hz and there is a frequency drop to below 50Hz afterwards, or whether the deviation takes place completely above or below the target frequency.
Further on, the 7 minutes around the hour break are considered (3 minutes before and 3 minutes after the hour break) and the frequency difference between the last and first minute of the observation window is calculated. This 7-minute window is iteratively shifted over the entire period from August 01, 2017 to March 31, 2018.
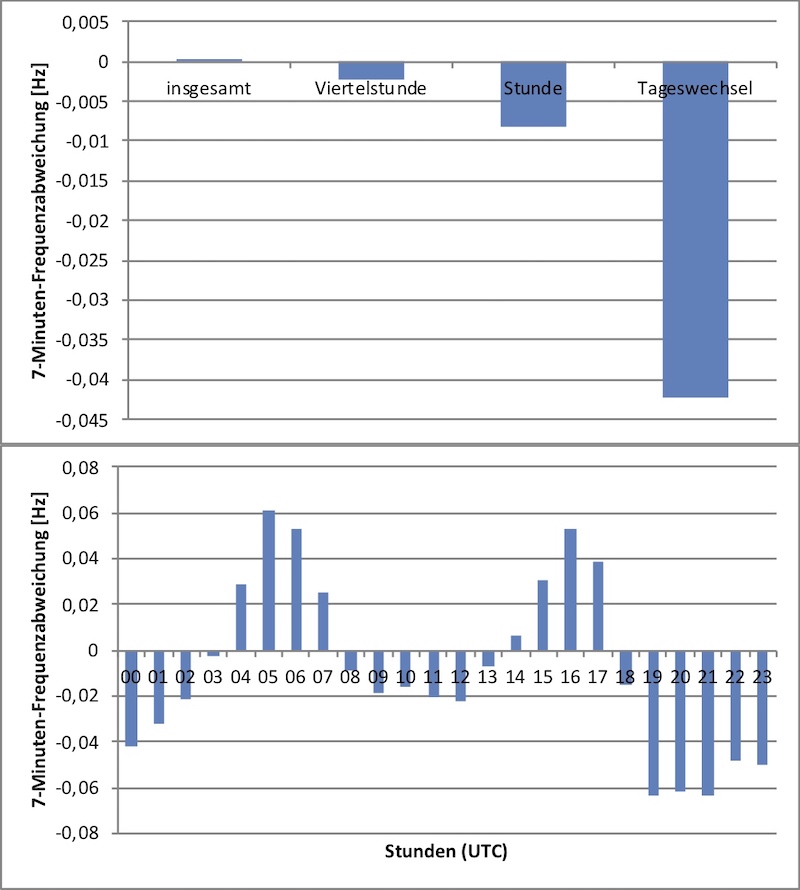
Key observations are shown in this figure. The top graph plots the average deviation overall, around the quarter-hour change, around the hour change, and around the day change. As expected, the overall average deviation is close to 0. The quarter hour deviations are much weaker than the hour deviations. The day change stands out in the figure by a large margin. This is due to the fact that the day changes all show an approximately equal decrease in frequency. The frequency deviation at the hour change, on the other hand, looks comparatively small at first glance with an average of -10mHz.
However, the first glance is deceptive, as positive and negative deviations approximately balance each other out across the different daytime hours. Four major phases can be seen in this graph. The transitions between positive and negative deviations (and vice versa) are accompanied by changes between high and low demand periods. For example, the hour changes during the classic morning ramp between 05:00 and 08:00 (03:00 to 06:00 for Central European Summer Time or 04:00 to 07:00 UTC for Central European Winter Time) are characterized by a positive frequency deviation. The hour changes in the evening and night hours, on the other hand, are characterized by a frequency drop (for further graphical analysis of the frequency deviations in the observation period, see www.energiestudium.de). Our evaluation corresponds to the observations of Dr. Gobmaier.
How might one interpret the observations made?
The identified pattern of positive and negative phases remains essentially the same over the entire observation period. This means that the underlying behavior of the frequency seems to follow probably systematic influences. Thus, these influences do not occur randomly and cannot be explained by seasonal (weather) or technically driven (e.g. revision-dependent) factors. Rather, they are effects that arise from common electricity trading products.
Most trading products in Europe are designed for hours or quarter hours/half hours or multiples of hours (blocks, peak/off-peak). Most European exchanges do not impose any requirements regarding the start-up and shut-down of generators or consumers. Therefore, generators and consumers follow the timing scheme of these products when feeding in and feeding out and, accordingly, with a few exceptions, do not shut down or start up their plants in a system-synchronized manner. At the beginning and end of the delivery period of the common trading products, there is an undersupply or oversupply of energy and thus a drop or rise in frequency. It is not decisive in which direction the deviation takes place. What is more significant for system stability is that a frequency deviation occurs.
The phenomenon of inherent frequency deviations can also be observed at the change of day. At the change of day, baseload products end or begin, which is to shed the base load prevailing in the power system throughout the day. Thus, the shutdown and startup of baseload generators at the change of day has the same effect on the grid frequency in terms of strength and duration as it does for shorter-term products.
Further considerations
The preceding interpretation of the observations assumes that systematically recurring frequency deviations could be artifacts of trading products. In that case, quotes that are not subject to the rules of common trading products would have to follow a different pattern or even counteract the observed effects.
By giving priority to the feed-in of fluctuating renewables such as wind and PV, Germany, for example, allows smaller generators a competitive advantage: operators of smaller wind and PV plants that are not subject to tendering rules can neglect wholesale market rules in their generation and feed-in. Their electricity supply is not subject to a strategy systematically adapted to the market. Accordingly, plants that are subject to feed-in priority should not cause a systematic feed-in effect at the change of hours. In the following, we will verify whether this group of generators has an impact on the amount of frequency deviation identified.
Determination of the effect of fluctuating renewables on the frequency deviation.
For this purpose, the frequency data are analyzed taking into account the German share of renewables in the feed-in power. The generation information is available in the SMARD database of the Federal Network Agency for each quarter hour. Therefore, these data show the level but not the actual output per observation time of the frequency data. Nevertheless, it is possible to tell from the generation levels how the PV-and-wind share of the total power affects the frequency deviation (the effect of short-term unavailability of power plants is analyzed, for example, in Krämer & Veith (2017)).
The share of non-available generators is determined on a quarter-hourly basis. Then, a statistical procedure is used to estimate the influence on the frequency deviation for each hourly transition. If the frequency deviation considering wind and PV differs from the frequency deviation without consideration, the result is statistically significantly different from 0.
Results considering the influence of fluctuating feed-in.
The central results of the estimations are shown in the following figure.
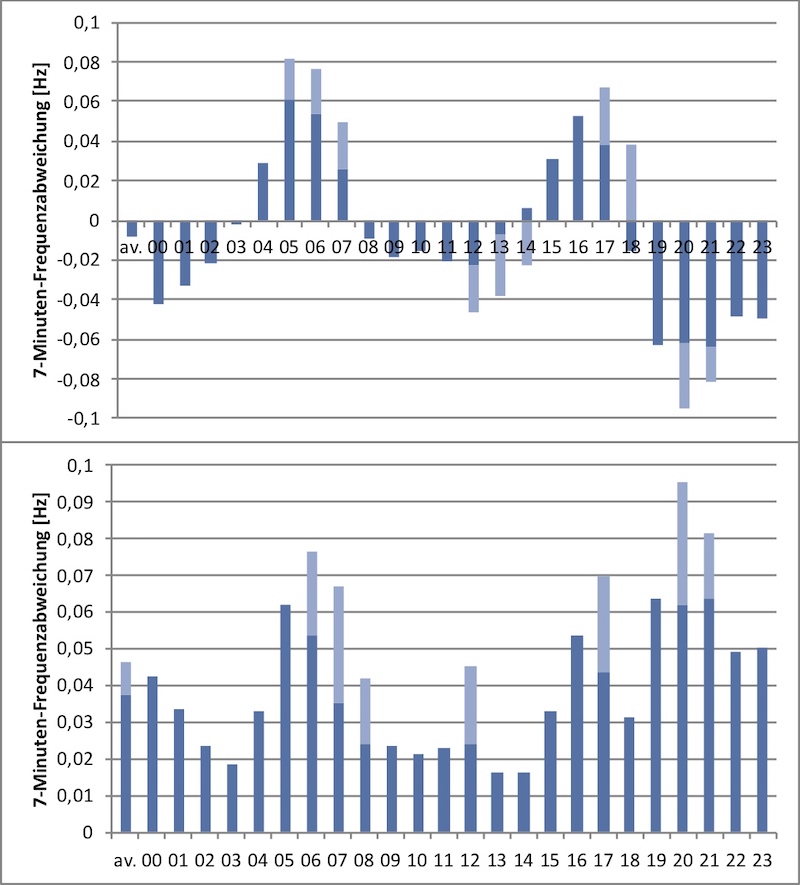
The upper graph corresponds to the previous figure supplemented by the effect of wind and sun. The lower graph shows the effect of wind and PV on the absolute frequency deviation.
It is clear from the graphs that the frequency deviation would be much greater, and generally in the same direction as the frequency deviation determined above: the average frequency deviation would be about a quarter (24 percent) higher over all hours without wind and PV (the only exceptions to this are the hourly breaks at 2pm and 6pm). If only the hours with a significant influence are considered, the frequency deviation would be even higher by more than half (56 percent). In addition, it is noticeable that wind and PV develop their damping effect especially during hourly changes with a particularly strong frequency difference and thus support the overall system especially during critical times.
The amplification of the previously identified frequency deviations at hourly changes when the share of wind and PV is reduced is a clear indication that the strong frequency deviations should indeed be artifacts of trading products. On the other hand, the neglect of defined delivery periods in trading products by smaller PV and wind plants (made possible by the feed-in tariff) has a system stabilizing effect.
Notes on the results
For the analysis, the German situation and thus the German feed-in share of wind and PV in the generation mix at the respective hourly change was considered. This is accompanied by a certain inaccuracy, as the German weather situation only reflects a section of the overall European weather situation. It is true that the installed capacity of PV and wind in Germany amounts to about 36 percent of the total installed capacity of the EU 28 (The share is determined on the basis of data in the wind energy and photovoltaic barometers for 2016 from Eurobserver (Eurobserver 2017a, Eurobserver 2017b). Nevertheless, countries like Spain have a significant impact on the grid stability of the overall European system due to their also high share of wind power plants and their simultaneously more favorable weather conditions.
In the previous study, no distinction was made between onshore and offshore wind. Especially offshore wind power plants are usually marketed as base load in long-term exchange products. Onshore wind turbines are partially marketed directly. Therefore, the dampening effect of wind turbines is also smaller than that of PV plants by a factor of about 8. (The distinction is not shown here. The subdivision between onshore and offshore wind power plants shows that offshore, in contrast to onshore, does not have a significant impact, which further substantiates the expectation).
Against this background, the results presented here are all the more significant as they only show the effect of Germany on the overall European system.
Conclusions
The reduction of RE support in Germany is expected to increase competition between different types of generation. In this context, it is argued that by now the share of renewables in the overall generation mix is large enough and thus competitive (see, for example, the justification of the EEG 2017 by the BMWi). Competitiveness notwithstanding, this article shows that the support for renewables in Germany to date also brings crucial benefits to the market and to the European energy system as a whole.
Trading products are typically not defined in a system-oriented way, or lack trading products that support the overall system against market-induced misallocations in terms of system stability. Instead, transmission system operators must address frequency deviations on their own. However, the stabilizing effect of fluctuating feed-in only takes effect if they feed-in with priority, independent of predefined structures of trading products. If one deviates from priority, RE producers will orient themselves to the specifications of standardized trading products. This would result in a further amplification of the frequency difference at the transition between two successive delivery periods. This can already be shown in the differentiated comparison of PV and wind power plants.
The trend towards more distributed generation will further exacerbate the frequency difference problem. Since a large part of the energy traded on exchanges is currently generated conventionally, there are still large flywheel masses on the grid that run down at the end of the delivery period. Decentralized renewables lack these flywheels. If conventional generation plants are replaced by smaller plants without (synthetic) flywheels, switching off a comparable amount of power at the end of the delivery period will result in a much faster frequency drop (see Gobmaier, 2017).
To counter such growing problems, there are essentially two cause-related alternatives:
- One possibility would be a handover product for the short window at the end and beginning of the delivery period of merchant products. Flexible generators such as gas-fired power plants, run-of-river power plants, pumped storage or, in the future, chemical storage could be used for this purpose. However, such a product would then have to be defined as a trading product by exchanges and not as a system product by transmission system operators. The difficulty in implementation, however, is that it is important to avoid a situation where such a product would not simply lead to a time lag of the identified problem.
- Another possibility is to supplement the definition of existing wholesale products with clear ramping requirements at the beginning and end of the delivery period similar to that of balancing power products in the Netherlands, for example. This would make generators responsible for the quality of the power and energy provided by the product over the entire product life.
Transmission system operators are generally responsible for system stability throughout the ENTSO-E grid area. They use balancing power to compensate for frequency fluctuations. The identified frequency differences can generally be sufficiently compensated by primary control power or Frequency Containment Reserves (FCR). Nevertheless, the identified frequency differences are systematically recurring influences on system stability that can be predicted relatively accurately and assigned to their cause. Both alternatives, therefore, assign responsibility to traders for the frequency difference they cause.
Literature
Eurobserver (2017a): Wind Energy Barometer 2017.
Eurobserver (2017b): Photovoltaic Barometer 2017