Frequency of continental UCTE grid drops to 49,8 Hz on 10 Januar 2019
There are many reports about the incident in the European power grid on 10 January 2019. But what exactly happened there? The only thing that can be said with certainty at the moment is that the grid frequency dropped to 49.80 Hz at 21:02, i.e. it was clearly outside the normal range. The nominal frequency is 50 Hz, with a controller dead band of +/- 10 mHz. This means that there is an insensitivity range from 49.99 Hz to 50.01 Hz in which no frequency control takes place.
Now, however, a disturbance of the electricity grid had presumably started in France (notification of the French energy regulator). There was an under-supply to loads, which was reflected in the grid frequency of the entire European power grid. As a result of the underfrequency or undersupply of the electricity grid, automatic load shedding of industrial plants in France became necessary in order to stabilise the grid frequency. In principle, frequency disturbances spread very quickly and therefore occur almost synchronously across Europe. However, the severity of the manifestation is distributed differently from region to region. In Spain, for example, the frequency deviation from the 50 Hz nominal frequency of 49.789 Hz (-211 mHz) was significantly stronger than in southern Germany with 49.802 Hz (-198 mHz).
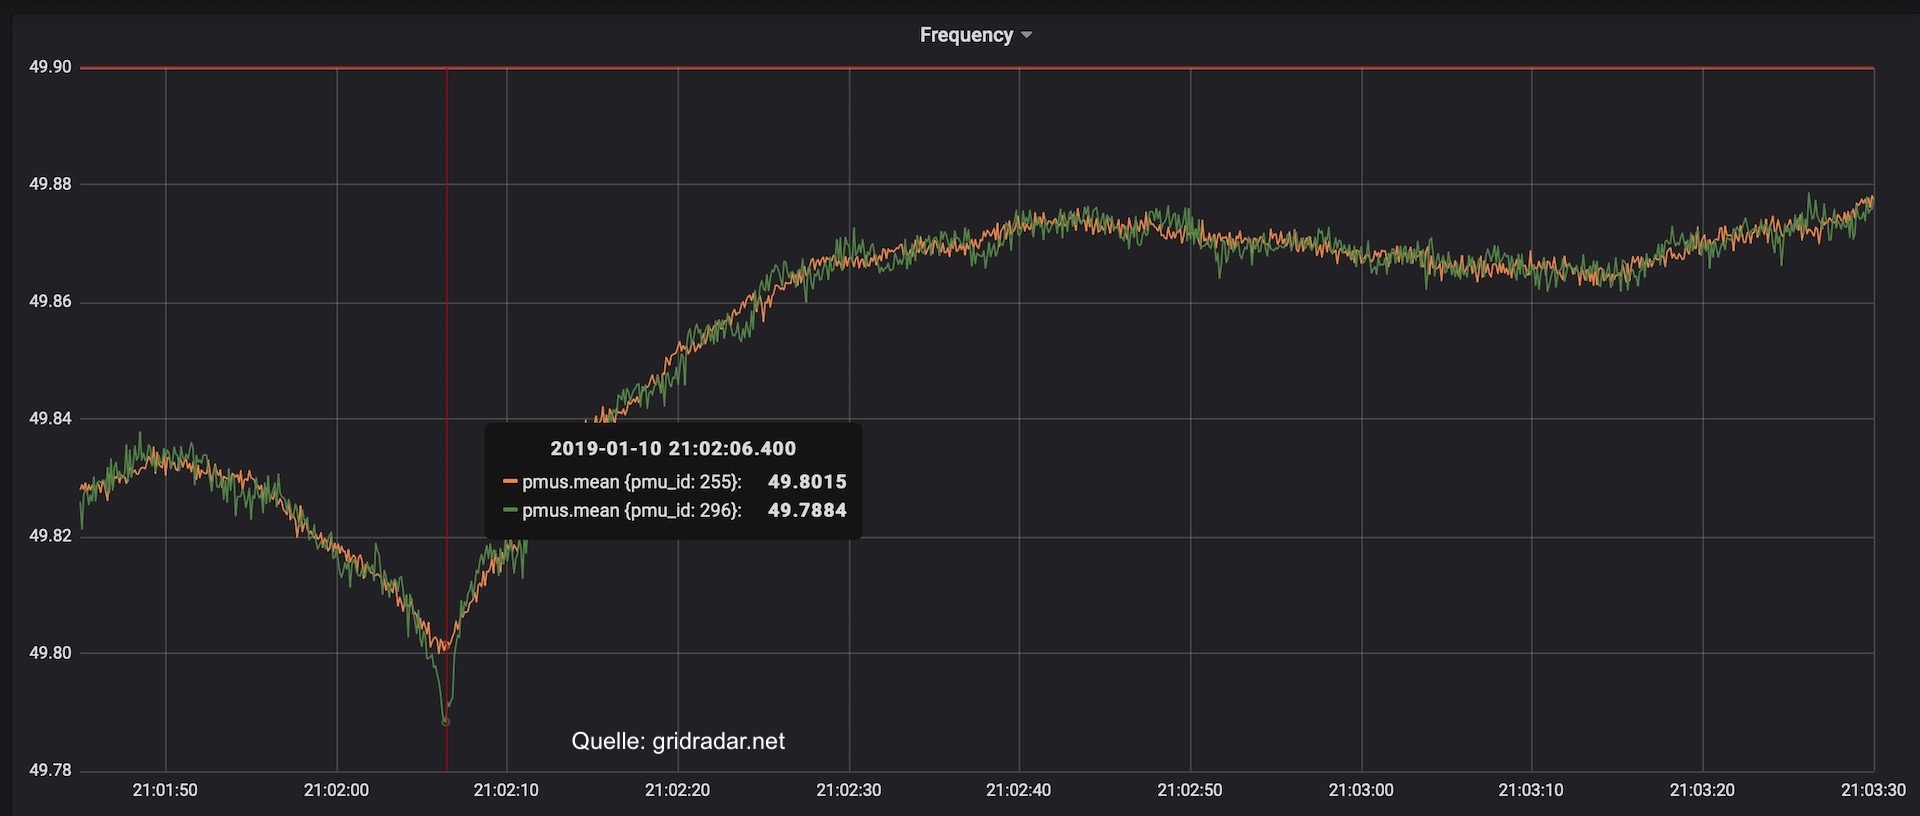
(legend: green - Lleida, Spain; orange - Donauwörth, Germany)
Now you may ask, why does this show up in the frequency?
The generation and consumption of electricity must always be in balance. This means that the electricity that is being consumed at this very moment must also be generated at this very moment. The nominal frequency in Europe is 50 Hz, as mentioned above. However, if there is an imbalance between generation and consumption, the frequency deviates from the target. In this specific case, at the peak of the disturbance, the frequency was 49.789 Hz, i.e. 211 mHz below the nominal frequency of 50 Hz. This in turn means that the feed-in from power plants was significantly lower than the power consumed by consumers. This feed-in shortfall resulted in a drop in frequency, which immediately became apparent in all parts of the European power grid due to the high meshing in Europe (the propagation speed of disturbances is approx. 1100 km/s).
Since the frequency dip shortly after the hour change is close to the ENTSO-E design case of +/-200 mHz (Kapitel A-D3.1.) As a counter-reaction to stabilise the grid, the aformentioned French electricity grid operator RTE shed approx 1500 MW by contractually disconnecting some industrial loads wurden.
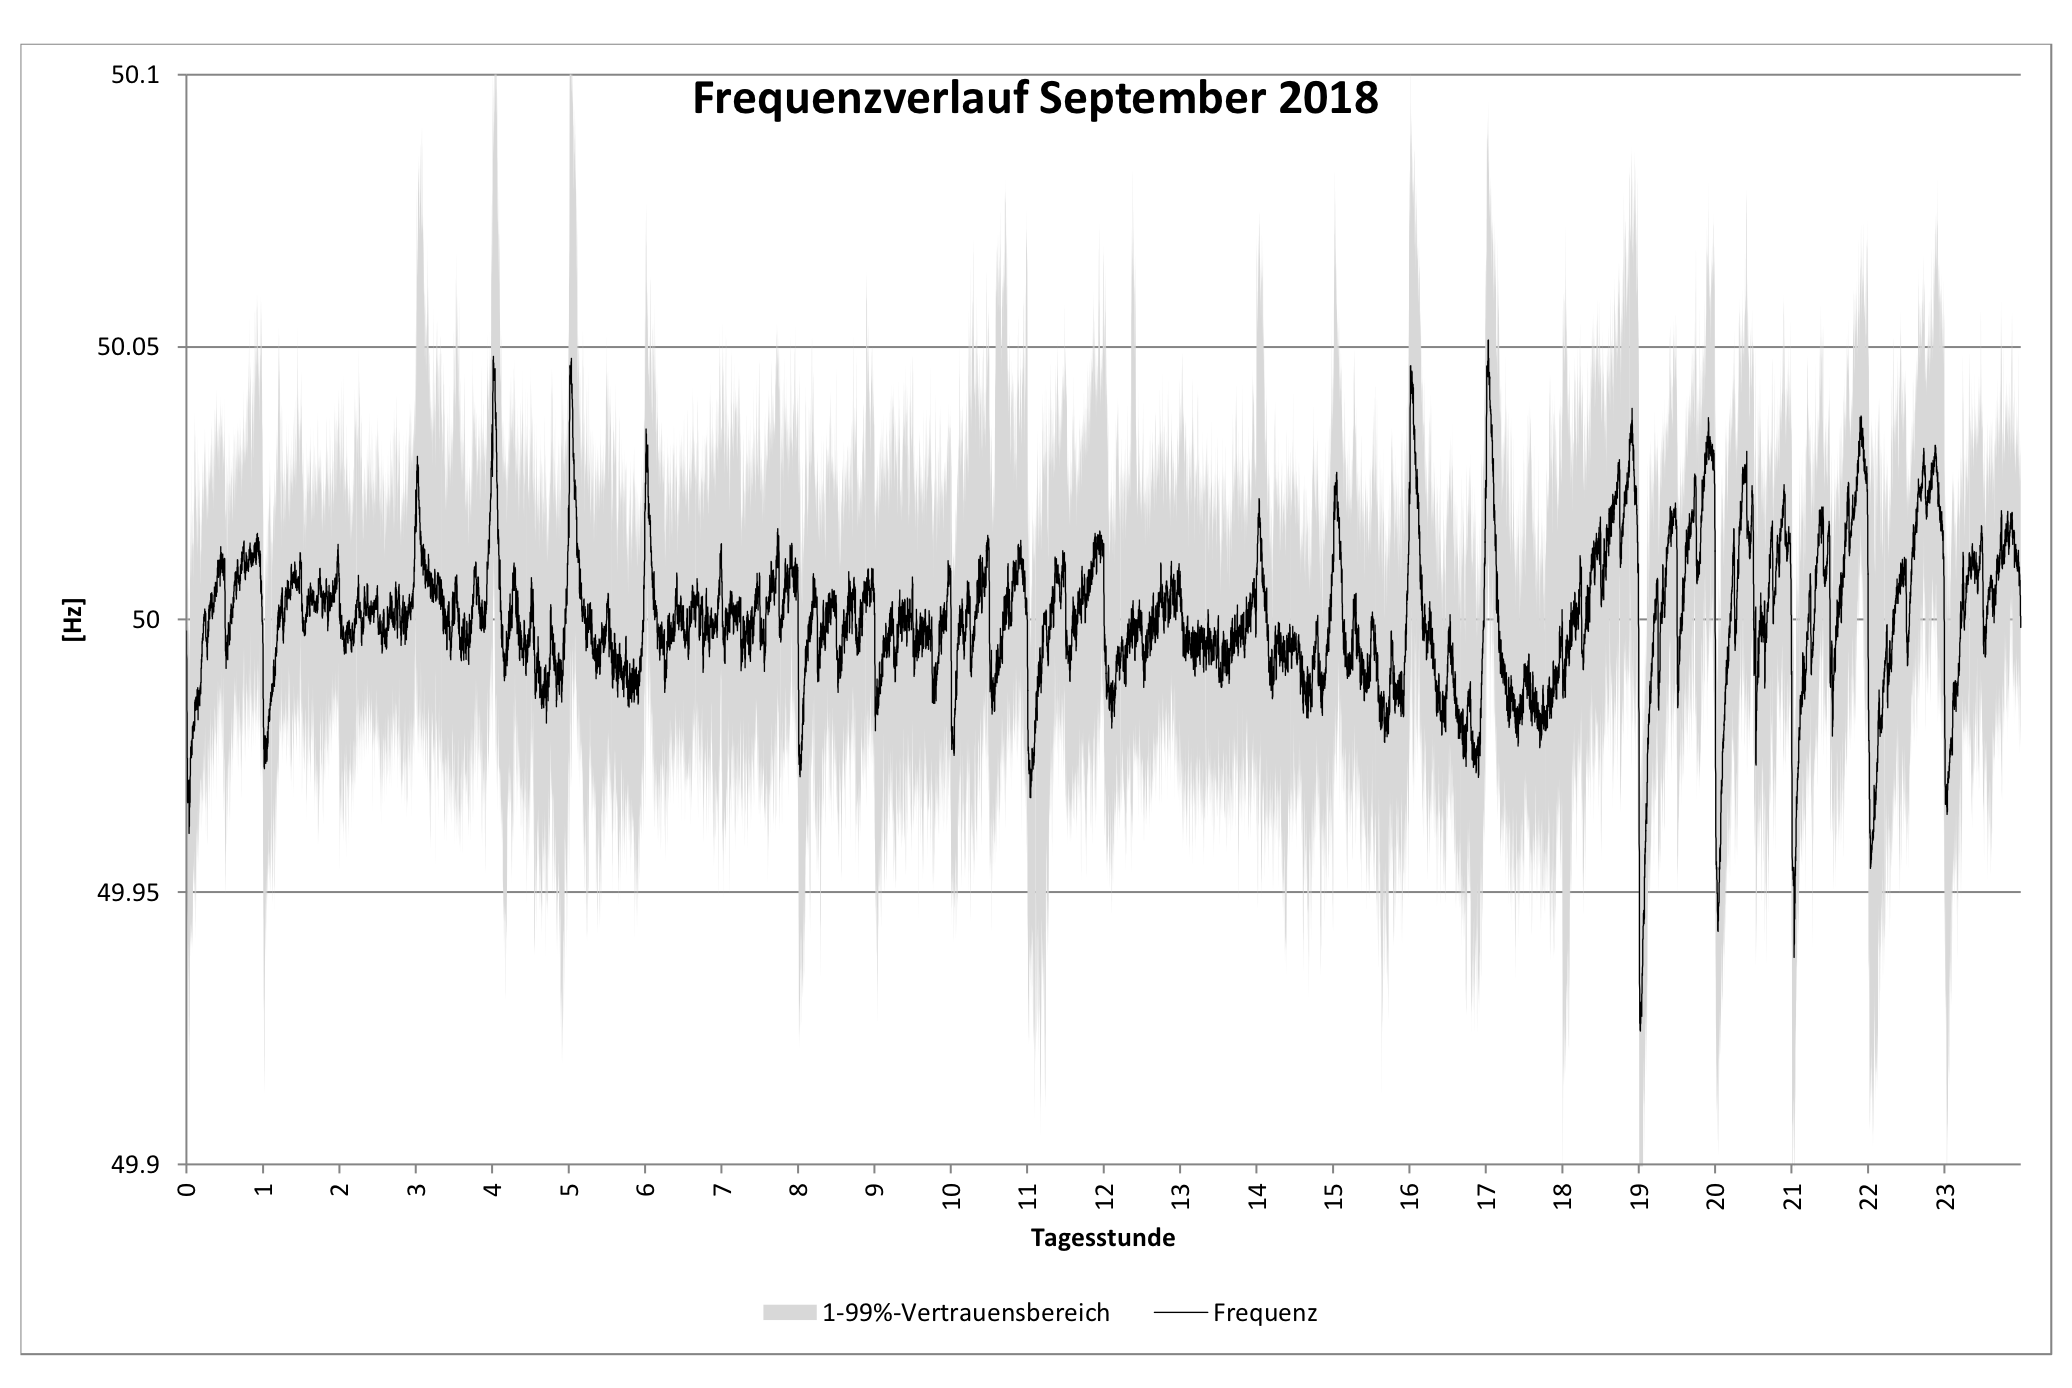
In the run-up to the hourly change, the frequency slowly started to drop due to power trading, but this is not an unusual behaviour in the evening hours. The background for this hourly drop in frequency is that there is a transition from power plant A to power plant B. For example, power plant A has sold a certain amount of power for the period from 20:00 to 21:00 and power plant B takes over the supply from 21:00. Since such a handover is not easy to manage, there is a short drop in frequency. This phenomenon repeats itself every hour and is shown in a typical pattern of a frequency curve within a day. However, shortly after the hourly break at around 21:01 on 10.01.2019, the frequency started to drop below 49.9 Hz, reaching the low of 49.78 Hz at 21:02. As the primary control power activated at this time was presumably insufficient to stabilise the frequency again, large consumers from RTE's industry had to be disconnected from the grid. Such load shedding has a similar effect to an adrenaline injection (in this sudden freeing up of generation capacities) on the power grid and, together with the injection of primary control power, prevented a grid collapse. Subsequently, the power grid stabilised again and the frequency returned to the normal frequency band shortly afterwards. The blackout was averted.
Significance of the phase angle - what does it tell us?
The phase angle, also called voltage angle, is an instrument to make power flows from A to B visible. With our WAMS, we record the frequency and the phase angle across Europe, so that load flows between stations or also line switches become visible. In the following diagram of the phase angle, not only transnational load flows but also primary control power swings can be seen.
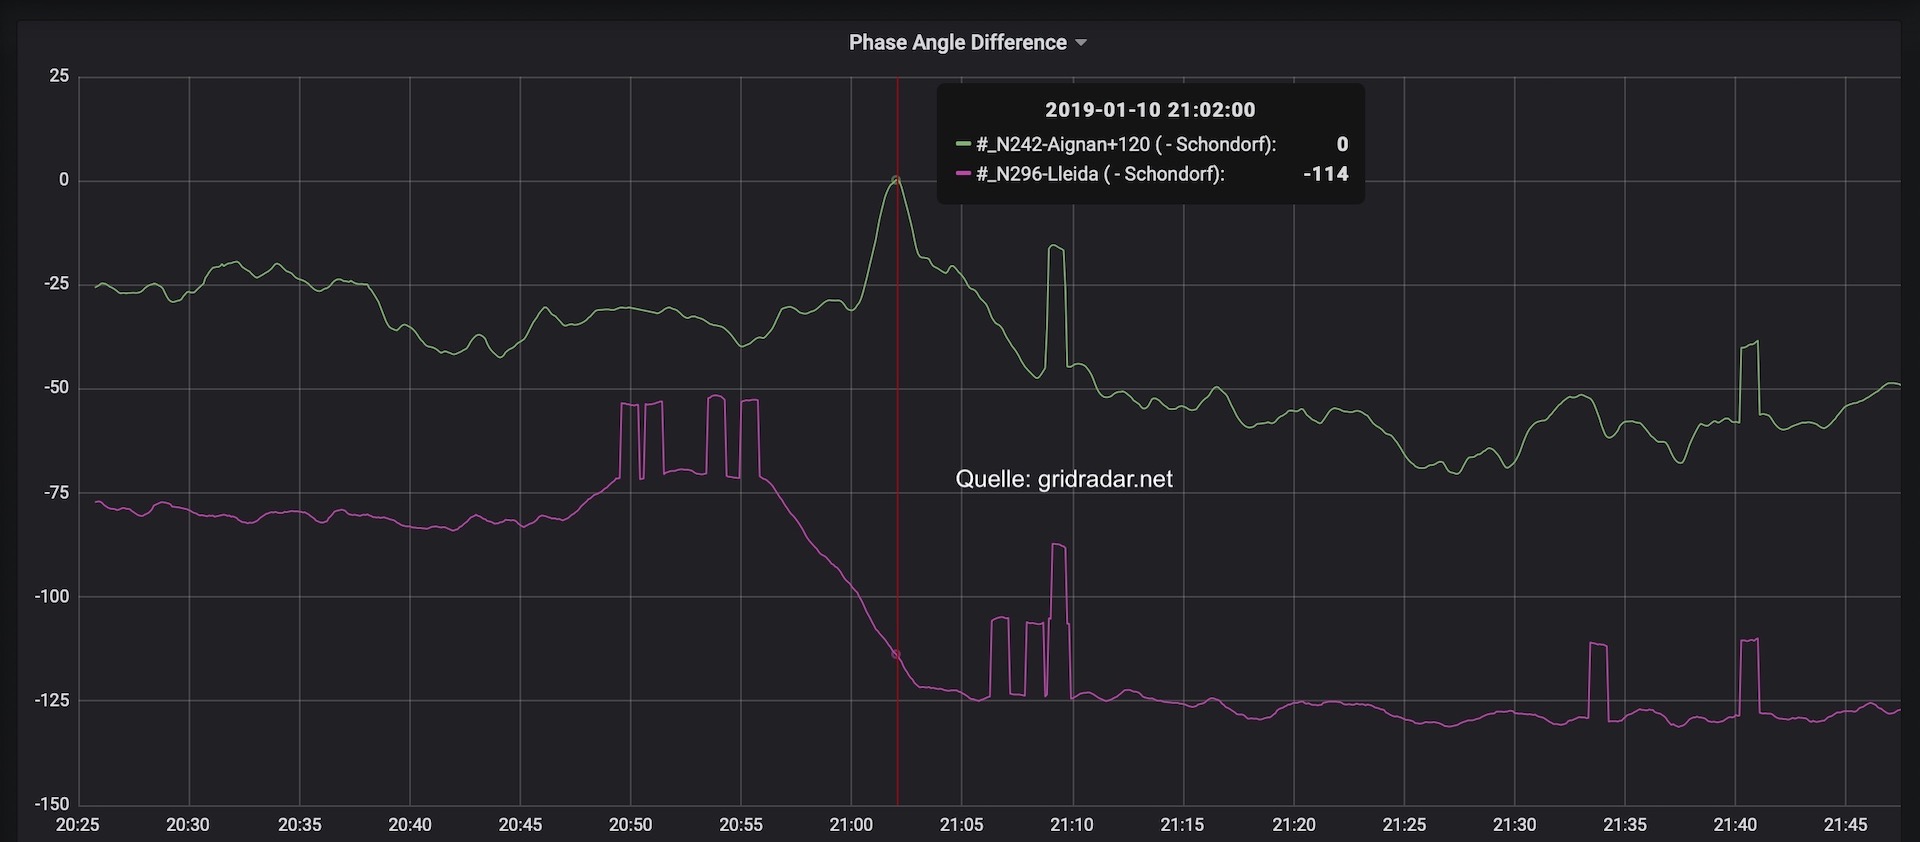
In the diagram we see that in the run-up to the change of the hour the station in Lleida (Spain) first shows a reduction in the phase angle compared to Schondorf (southern Germany), i.e. the angular difference between the measuring station in southern Germany and Spain falls. However, in the further course from approx. 20:55, shortly before the hourly break, the angular difference increases massively by almost 50°. This means that the load flows have changed and Spain took up power after the hourly change. Reasons behind the change could be, on the one hand, that the coal-fired power plant Litoral 1 failed around 21:00, but probably also cross-border electricity trading.
Looking at the import and export balance of the French grid operator RTE, it is easy to see that France imported a net 4261 MW at 20:00 on 10.01.2019 and only received a net 947 MW at 21:00, i.e. the power imported from abroad fell by 3314 MW with the change of the hour (a power of the order of about 3 nuclear power plants or 4 hard coal-fired power plants).
As can be seen in the graph of the French RTE, 2246 MW were still imported from Spain at 20:00, but with the hourly change at 21:00 the flow of electricity reversed and 2117 MW were exported to Spain, i.e. a hub of over 4.3 GW! Hence the change in the phase angle diagram with the phase angle of the station in northern Spain drawn in purple. The phase angle of the measuring station in southern France (installation site near Toulouse and the Golfech nuclear power plant there) drawn in green shows the counter-reaction to the frequency collapse shortly after 21:00 to 21:02, since massive primary control power was probably used by the nearby nuclear power plant to stabilise the grid. In addition to the frequency, the phase or voltage angle is therefore an interesting instrument for making load flows or failures visible and locating them.
In contrast to the incident in November 2006, this time the protective mechanisms worked well and there were no major or even widespread supply interruptions.
As of 20.01.2019