
Continental Europe
Raw frequency data: Do you need raw frequency data from continental Europe to optimise your market model?
We offer raw data, as well as the median, with different resolutions - available are 1, 10 and 6000 samples/second. You receive a solid database for your real-time market model, your own grid analyses or for setting up your own alert system.
You can access this data in just a few steps via the Gridradar API.
Do you need a low-latency solution (< 300 ms)? We offer a ready-made software solution based on the IEEE C37.118 standard. You can easily install our Docker container and connect it to your systems.
Target group: Traders, portfolio managers, grid operators.
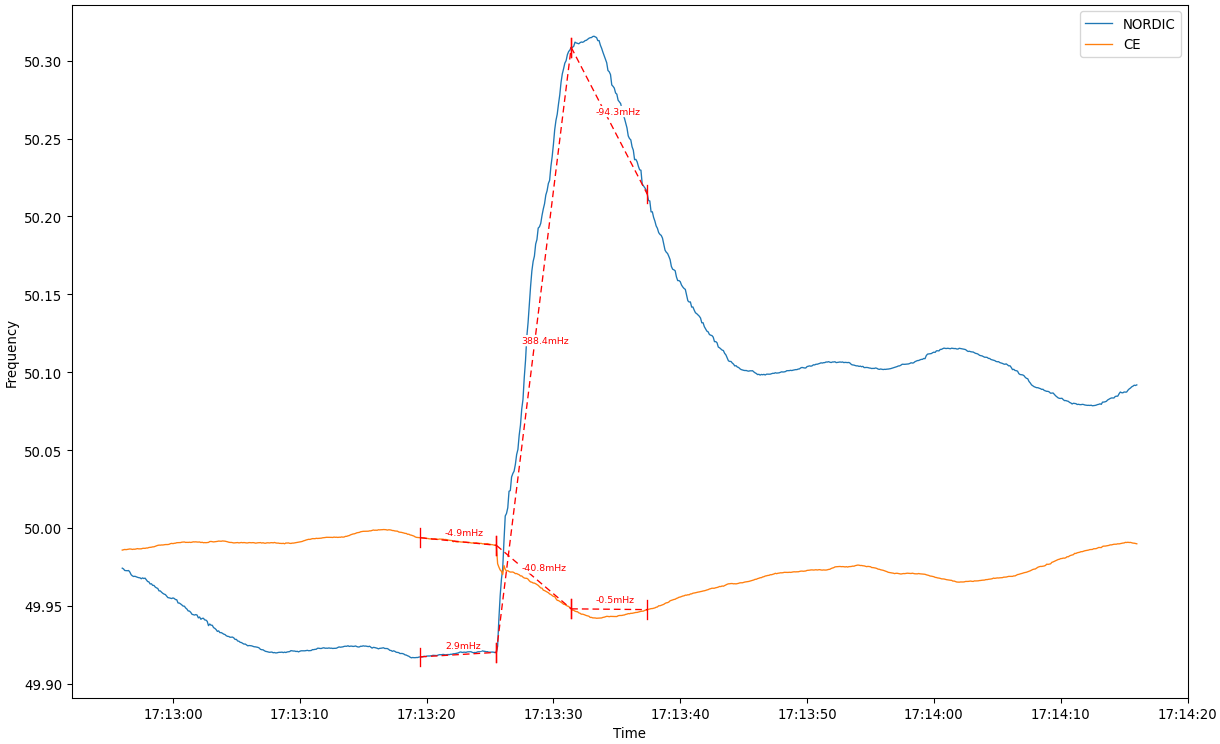
Interconnector failure alert: Interconnectors act on grids like large generators or consumers. In the event of failures in the import situation, the frequency can drop by several hundred millihertz within milliseconds and increase by several millihertz in the export situation. The problem is all the greater the less inertia there is in a grid and the smaller a grid is. The UK and Scandinavia are therefore particularly affected by the problem.
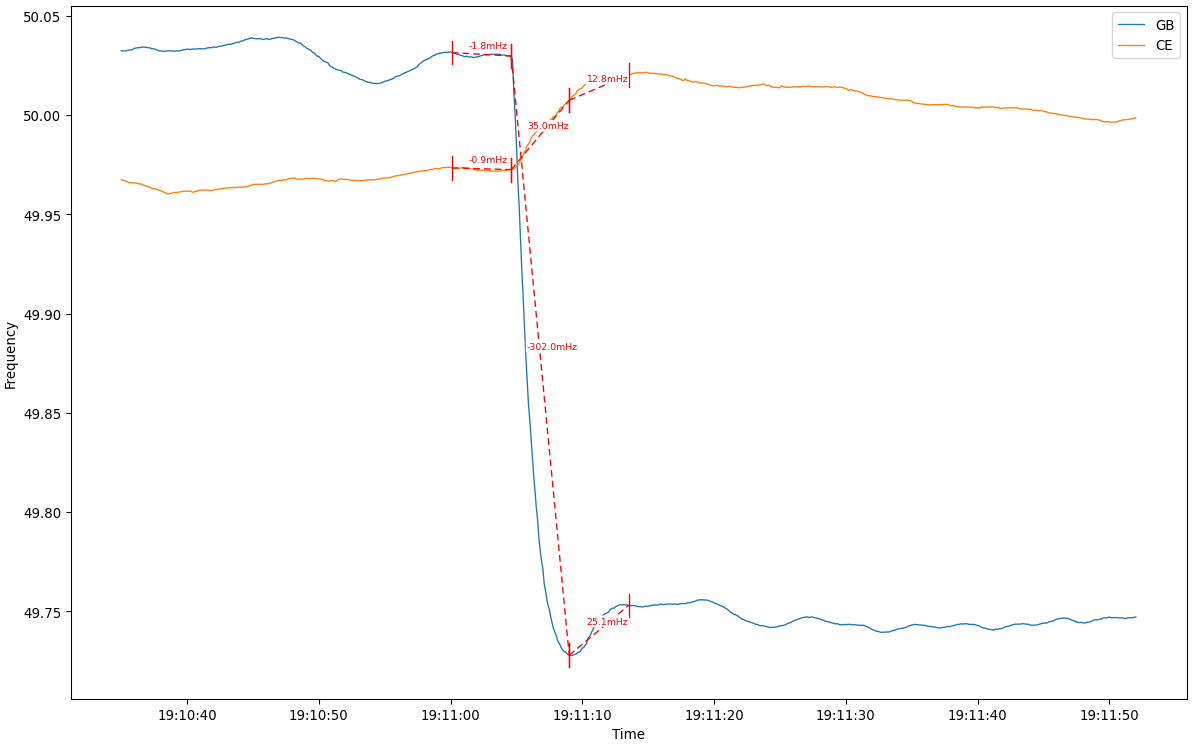
The interconnector failure alert provides its recipients with a reliable signal as to whether a connection between one of the three networks in continental Europe, the UK and Scandinavia has failed. Market parties, such as batteries, are thus in the know well in advance of the official announcement that an important interconnector has failed.
Target group: Traders, portfolio managers of flexibilities and batteries.
Great Britain
Raw frequency data: Do you need raw frequency data from continental Europe to optimise your market model?
We offer raw data, as well as the median, with different resolutions - available are 1, 10 and 6000 samples/second. You receive a solid database for your real-time market model, your own grid analyses or for setting up your own alert system.
You can access this data in just a few steps via the Gridradar API.
Do you need a low-latency solution (< 300 ms)? We offer a ready-made software solution based on the IEEE C37.118 standard. You can easily install our Docker container and connect it to your systems.
Target group: Traders, portfolio managers, grid operators.
Interconnector failure alert: Interconnectors act on grids like large generators or consumers. In the event of failures in the import situation, the frequency can drop by several hundred millihertz within milliseconds and increase by several millihertz in the export situation. The problem is all the greater the less inertia there is in a grid and the smaller a grid is. The UK and Scandinavia are therefore particularly affected by the problem.
The interconnector failure alert provides its recipients with a reliable signal as to whether a connection between one of the three networks in continental Europe, the UK and Scandinavia has failed. Market parties, such as batteries, are thus in the know well in advance of the official announcement that an important interconnector has failed.
Target group: Traders, portfolio managers of flexibilities and batteries.
Nordic
Raw frequency data: Do you need raw frequency data from continental Europe to optimise your market model?
We offer raw data, as well as the median, with different resolutions - available are 1, 10 and 6000 samples/second. You receive a solid database for your real-time market model, your own grid analyses or for setting up your own alert system.
You can access this data in just a few steps via the Gridradar API.
Do you need a low-latency solution (< 300 ms)? We offer a ready-made software solution based on the IEEE C37.118 standard. You can easily install our Docker container and connect it to your systems.
Target group: Traders, portfolio managers, grid operators.
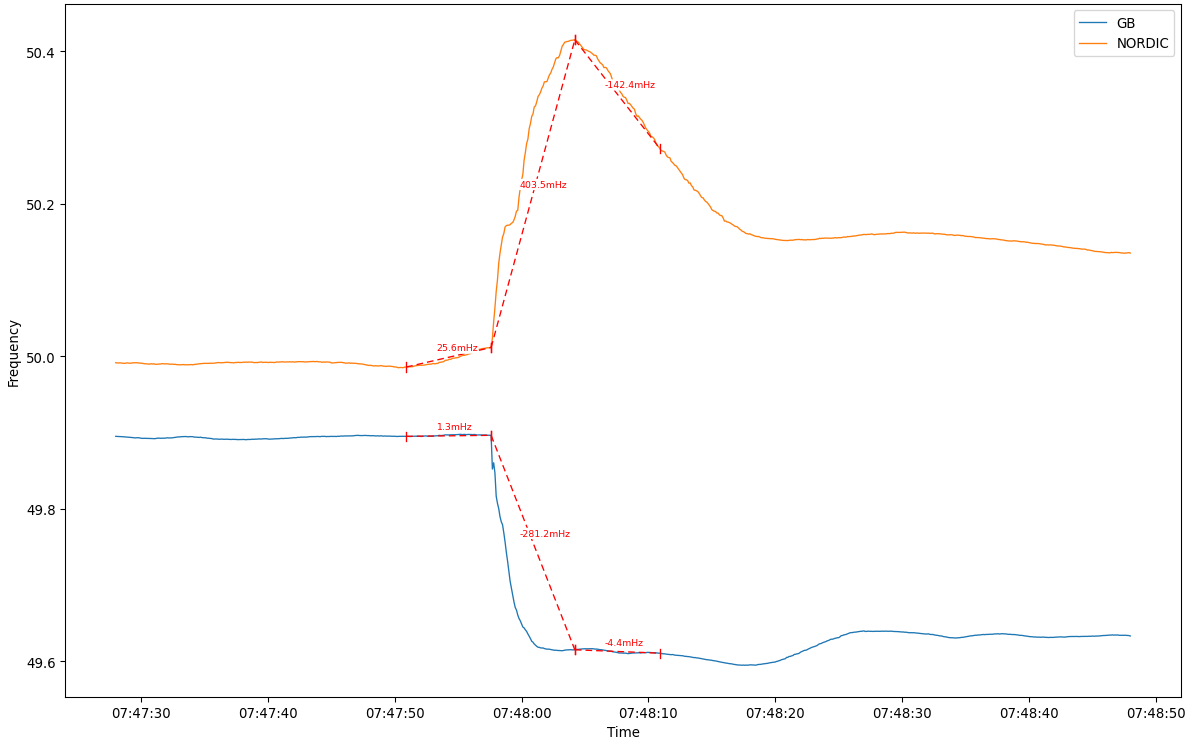
Interconnector failure alert: Interconnectors act on grids like large generators or consumers. In the event of failures in the import situation, the frequency can drop by several hundred millihertz within milliseconds and increase by several millihertz in the export situation. The problem is all the greater the less inertia there is in a grid and the smaller a grid is. The UK and Scandinavia are therefore particularly affected by the problem.
The interconnector failure alert provides its recipients with a reliable signal as to whether a connection between one of the three networks in continental Europe, the UK and Scandinavia has failed. Market parties, such as batteries, are thus in the know well in advance of the official announcement that an important interconnector has failed.
Target group: Traders, portfolio managers of flexibilities and batteries.
aFRR Direction Forecast – now up to 90 minutes ahead
The enhanced Gridradar aFRR Direction Forecast provides critical insights into the dominant aFRR activation direction. Particularly valuable for traders, portfolio managers of flexibilities and batteries, or balance group managers.
Below, the continuously generated forecast results are displayed with a time delay. Arrows indicate the activation direction, while their size and accompanying percentage reflect forecast accuracy. Click on an arrow to view detailed quarter-hour forecasts.
Choose your product:
- Real-Time Forecast: For the current quarter-hour
- Medium-Term Forecast: Up to 60 minutes before activation
- Long-Term Forecast: Up to 90 minutes into the future
Interested? Let’s arrange a trial period: info@gridradar.net
Publication of the control reserve demand
The chart below shows the timing of the official publication of reserve power activations for the last quarter-hour over the past 24 hours.
Find out more here.
API
The API provides you with current and historical data from our monitoring system in real time. Science and research receive access free of charge, of course.
Forecasts
Reliable forecasts are the central input for your business. We combine network information with weather data and offer you highly reliable information!
Monitoring System
Gridradar offers you a cross-regional insight into the state of the power grid in real time. For this purpose, Gridradar uses measuring stations throughout Europe, both its own and cooperative stations.
Forensics
We support you in the analysis of market results due to unexpected system and generation situations.