Influence of major events on the grid frequency
Introduction
We would have been happy: Eagerly awaiting the footie game we sit spellbound in front of the telly. At the half time break we follow natures call. We're happy when our team wins and scold the others when they win. ... and the network operators? They look forward to the half-time break and are happy when the games are over, no matter who wins - not quite.
Major events like international football tournaments can not only be watched on television but also on the net, more precisely on the basis of the net frequency. This is because the behaviour of a large number of energy consumers is synchronised during such events. When the referee blows the whistle for half-time, the running starts on the other side of the pitch: We grab a beer from the fridge. We quickly put the pizza in the oven. We go to the toilet.
The story is not new. What is new is that deterministic effects are statistically verifiable not only in final matches. To this end, we systematically examined the 64 matches of the 2018 World Cup.
In the following, significant effects of the matches are elaborated and analysed.
Germany vs. Mexico
For a better understanding of the facts, let's look at the course of play in the Germany-Mexico preliminary round match on 17.06.2018 in Figure 1. The example shows the typical effects.
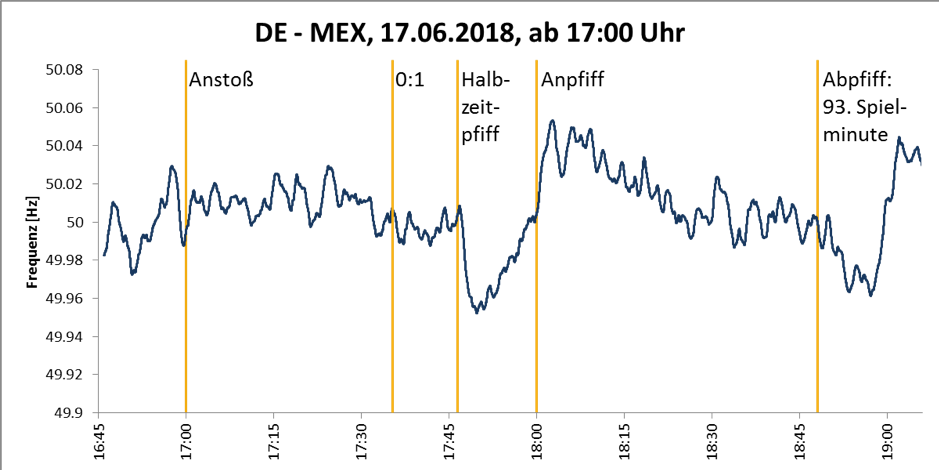
Image 1: frequency plot (1 min average) Germany - Mexiko
Shortly before the start of the match, the grid frequency drops and then rises again from 17:00. At the beginning of the half-time break, the grid frequency suddenly drops sharply and then rises again. No other effects (apart from the 7:00 p.m. jump) can be discerned, not even at the time of the 0:1. Jaschinsky already points to a central aspect that must not be ignored in the analysis: Besides the effects from the game, other deterministic frequency effects must not be neglected. As shown among other things, trading effects have a significant influence on the grid frequency, especially at the change of the hour. Typically, positive frequency deviations appear around 17:00 and negative ones around 19:00. There is no clear statement for 18:00. Taking these aspects into account, no significance should be attached to the 5:00 p.m. development here. It therefore remains in particular to consider the development at the half-time break.
Alle Spiele im Vergleich
Is this observation, as shown in the example, typical? Figure 2 shows the mean frequency curve and the 95% confidence interval across all matches. The width of the confidence interval indicates how much the frequency varies per time point when comparing all matches. While the mean frequency is very even during the regular playing time (blue line), the confidence interval is wider at the beginning of the first half (minute 0) and at the beginning of the second half (minute 45). These fluctuations are not so much due to the matches themselves but to the change of hours. This is because the matches all started on the hour, and accordingly the second half also started on the hour. (The changes from minute 105 onwards are due to the fact that only very few matches went into the second overtime (five matches) and almost all of them took place on different days. As a result, the frequency curve shows relatively large differences during these few time slots).
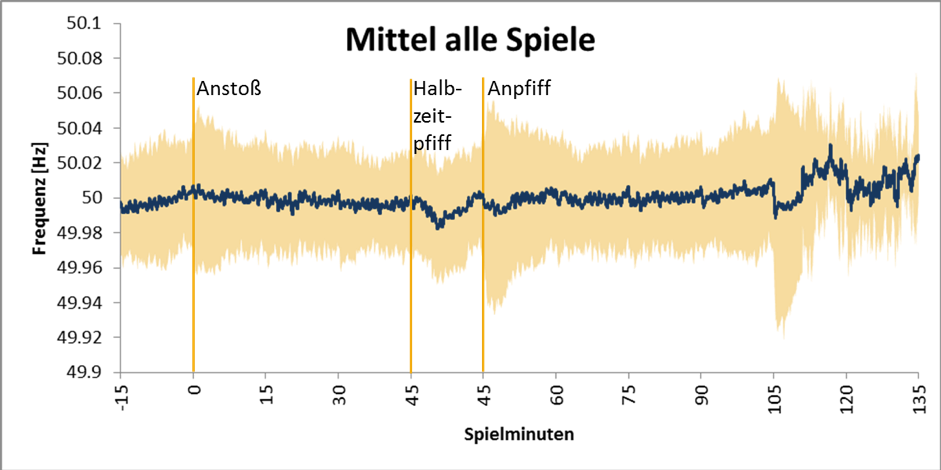
Image 2: Mean frequency response and 95% confidence interval of all 2018 World Cup matches
In the 15 minutes between the half-time whistle and the whistle for the second half, a slight drop in frequency can be seen again. The slower drop in frequency at the beginning of the half-time break compared to the Germany-Mexico match can be explained by the fact that the half-time whistle does not blow exactly after 45 minutes, but varies over the matches. Therefore, for some matches the drop in frequency begins after 45 minutes and for others only later. On average over all matches, it looks as if the frequency drop per second (the Rate of Change of Frequency/ RoCoF) is lower.
The question remains whether the drop in frequency at half-time is at all statistically significant compared to the stochastic frequency fluctuations over time. A so-called t-test shows that the frequency at half-time is significantly lower by 9 mHz than during the regular playing time. This seems negligible. Especially since this would definitely not induce a control power call, for example.
But this is only half the truth. The deviation of 9 mHz refers to the entire half-time break. The more decisive deviation at the peak is just under 19 mHz on average, with a systematic undershooting of the controller deadband in the half-time interval of just under four minutes (226 seconds). This means that positive control power is definitely used, on average, in all World Cup matches.
With higher granularity in the dimensioning of the secondary control reserve (automatic frequency restoration reserve) and the calendar-day tenders, there is certainly potential here for control reserve providers. It should therefore be considered when it is particularly attractive to offer positive control reserve.
Usual analyses to distinguish between weekdays and weekends or different hours of the day show hardly any statistically significant differences. Only the 25 matches starting at 8:00 p.m. led to a significantly higher frequency reduction at half-time (minor exceptions are the matches starting at 12:00 p.m. (France - Australia, 16.06.2018, preliminary round) and at 6:00 p.m. (Peru - Denmark, 16.06.2018, preliminary round). Evening matches have such a strong impact because these matches are watched by more spectators. This creates the problem of the synchronicity of spectator behaviour.
Importance of the games in the tournament for the frequency
Instead of the time of day, the importance of the match in the tournament could also have an effect on the frequency deviation. This is because more viewers are interested in the final or semi-final matches than in preliminary round matches. With this in mind, we compared knockout round matches with preliminary round matches.
Figure 3 shows the average frequency curve of the preliminary round matches and the knockout round matches. It is noticeable that the drop in frequency during the half-time break in the knockout round matches was higher than in the preliminary round matches. The strongest frequency drop of around 28 mHz was during the final match. Stronger frequency drops can also be seen in the semi-finals. All the other matches (including the small final) had a similar drop in frequency as the preliminary round matches.
This observation in frequency mirrors the viewer interest: 516.6 million viewers worldwide watched the final, 327.5 and 314.6 million viewers watched the semi-finals Croatia-England and France-Belgium respectively. According to FIFA estimates, one [quarter of the viewers came from Europe].(https://resources.fifa.com/image/upload/njqsntrvdvqv8ho1dag5.pdf).
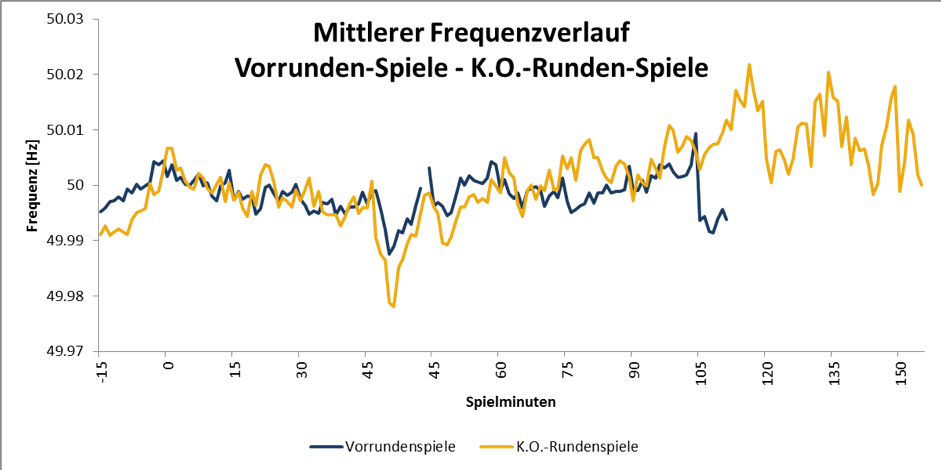
Image 3: Comparison of preliminary round matches and knockout round matches (one minute average)
It's the team that counts
The question remains whether, apart from the phase of the tournament, matches of certain teams also have an influence on the frequency. For example, do Germany matches have a greater impact than England matches? To clarify this question, we have examined the influence of games with German, English, French, Croatian, Portuguese and Spanish participation on the drop in frequency at half-time using a regression analysis. We control for the already known significant influences. The results are summarised in the table.
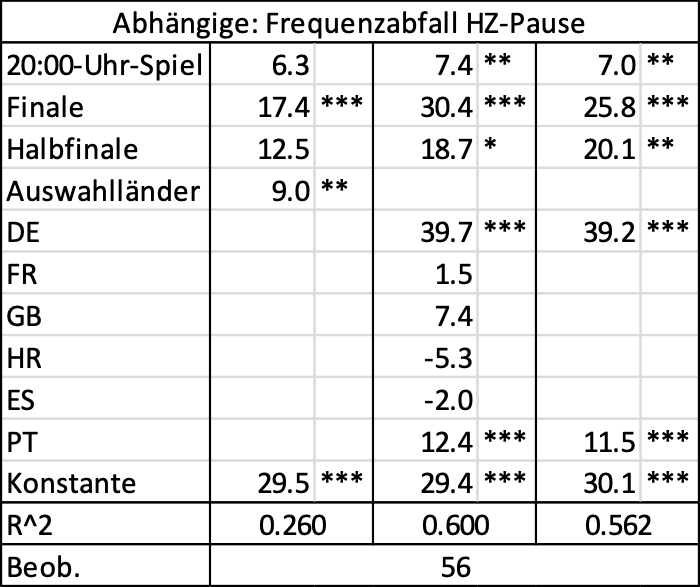
Table 1: Regression analysis
*** means significant at the 1 percent significance level, ** at the 5 percent and * at the
10 percent significance level.
The regression results show that matches involving the selected countries lead to a 9 mHz greater frequency drop during the half-time break than all World Cup matches together. However, only matches with German and Portuguese participation stand out explicitly: the three German matches led to an additional frequency drop of almost 40 mHz, those with Portuguese participation to one of about 12 mHz (the effect with the Portuguese matches is presumably due to the fact that the matches, with one exception, took place in the evening hours). Interestingly, the frequency drop for matches with French or Spanish participation is not significantly different from all other World Cup matches. Obviously, the German matches had a particular influence on the network frequency, over and above the time-of-day effect.
Conclusion
The World Cup has shown what influence football matches - or better: the referee - have on the grid frequency. The final whistle of the first half triggers the biggest drop in frequency during a match. But not every referee has the same amount of power as the other: Whoever whistles the final lowers the net frequency by around 25 to 30 mHz, whoever whistles the semi-final only by around 20 mHz. Whoever whistles an 8 p.m. match lowers the mains frequency by about 7 mHz. Referees of Germany matches have lowered the frequency by almost 40 mHz - always in addition to the 9 mHz already taken into account for all matches. Interestingly, providers of balancing power have not yet reacted by adjusting prices. This may be because the market rules have not yet made this attractive enough. After all, it was only on 11 July 2018 that the SRL was changed from a weekly to a calendar-day auction. With the additional daily dimensioning, the games and associated frequency forecasts become more interesting for the balancing power market.
It's a pity that the European Championship has to be postponed. We would have hoped for exciting games - on the net and especially on the pitch.