
German renewables stabilize the power grid
In a previous analysis, we had examined stabilization effects through renewables. You can read about this here on Gridradar.net and in our BWK publication from September 2018. The article examined how frequency deviations occur and whether a pattern can be observed in this. It is found that frequency deviations occur mainly right after the hour change. From the frequency deviations it is concluded that a direct connection with trading products at power exchanges could exist. For the study, data from a measurement station in southern Germany between August 2017 and March 2018 are aggregated in a 7-minute window (3 minutes before to 3 minutes after the observation time) and then the deviation within the period is analyzed.
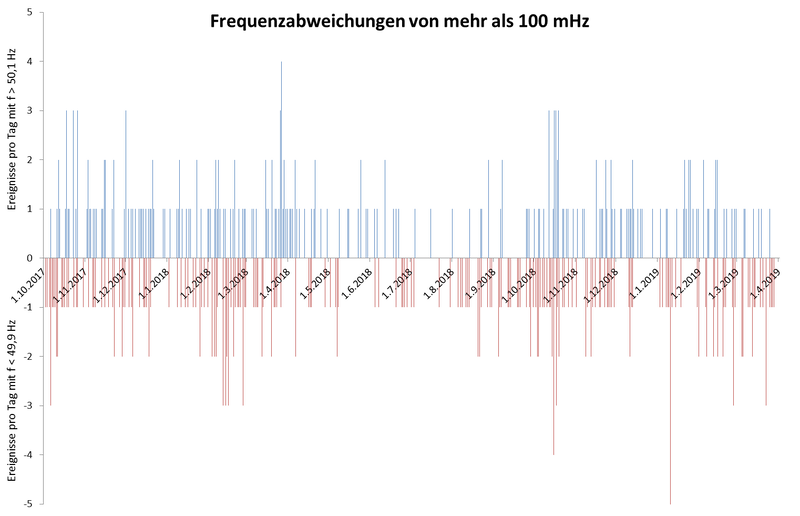
Long-term analysis of frequency since October 2017.
We revisited the considerations of the article and analyzed them in a larger context. The background of the investigation is whether the identified effects are also detectable in the longer term. For the period between October 2017 and April 2019, we analyzed all events where a deviation of the actual frequency of more than 100 mHz from the target frequency occurred, i.e., frequencies < 49.9 Hz or > 50.1 Hz. This threshold was chosen because primary control power (PRL) is definitely already being used in this frequency range to stabilize the power grid.
For the analysis, data from all grid radar measuring stations were aggregated on a second-by-second basis. By combining them over several measuring stations, those events can be filtered out where the defined threshold is exceeded locally in the short term. In addition, events that occurred within five minutes of each other in one direction were aggregated. Since 100 mHz is not a fixed threshold in the ENTSO-E Operational Handbook or with national regulators, it is more common for frequency deviations to occur around this threshold. Thus, these belong to the same event even if they fall below the threshold for a short time.
Findings from the survey
General presentation of the data
The investigation is based on 509 events in which the frequency deviated more than 100 mHz on average. The following figure shows that such stronger positive deviations and negative deviations are pretty much in balance. It is noticeable that overall fewer deviations occurred in the summer months than in the winter months. This may well be due to the fact that the summer months of 2018 saw exceptionally long and stable weather, with relatively little conventional generation being used, even compared to previous years.
The majority of events were singular events.
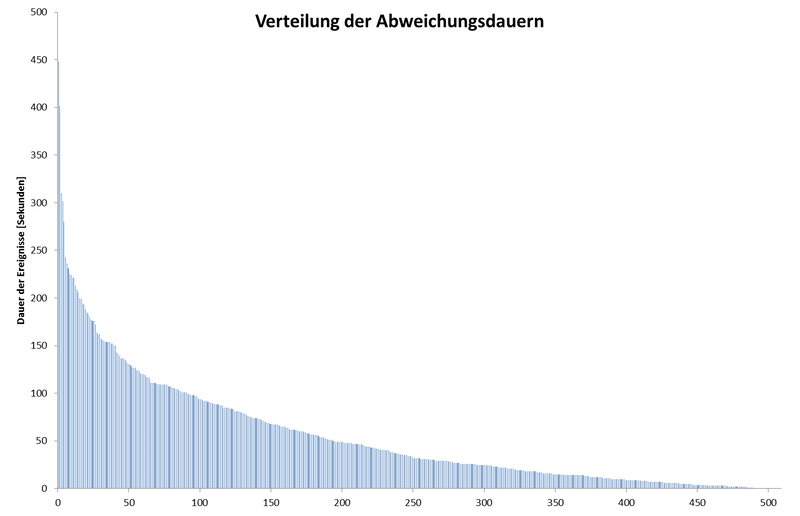
The distribution of outage durations shows that two-thirds of the frequency deviations lasted less than a minute, but more than 50 percent of the events exceeded the critical limit of 30 seconds. This is relevant because frequency deviations > 30 seconds start the activation of secondary control power in Germany. Since no deviation from the intended 10 mHz for activation of control power but from 100 mHz is considered here, this observation is a rather conservative estimation of the duration.
Despite smaller plateaus around 100 and 150 seconds, there is an expectedly even distribution of deviation durations with few long-lasting events and many of short duration. No significant differences between positive and negative deviation can be seen (which is why this is not shown here).
While the graphs show the general distribution of frequency deviations over time, the following section will explore whether specific temporal patterns or event-related patterns can be identified in the data.
Consideration of deviation patterns
In the article "Renewable energies have a stabilizing effect on the interconnected grid", particularly pronounced deviations around the hourly break were identified. Therefore, the first step is to clarify whether these deviations could be identified rather coincidentally due to the aggregation method used or the time period considered, or whether they can also be confirmed by the analysis method used here. The following graph shows the distribution of events over the course of hours.
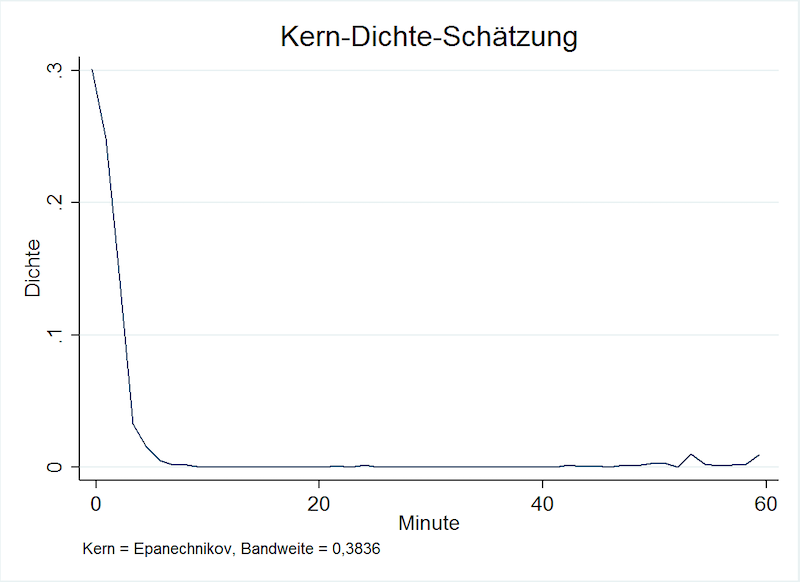
It can be seen that the majority of events (93.7 percent) can be identified in the time window between minute 0 and minute 5. Thus, the hour break is the key driver here as well. The other events occur almost exclusively in the last quarter of an hour. This distribution suggests that the hour break is the driver for systematic larger deviations in frequency. The background for this observation is probably that at the change of hours, the delivery periods of suppliers expire or those of other suppliers start, but the "handover" between previous and subsequent suppliers is not coordinated. Therefore, earlier suppliers already change their feed-in before the hour change, while later suppliers do not yet provide full power at the hour change.
Therefore, the question arises as to whether the hour change causes the system to underfrequency rather than overfrequency. The following figure shows the results of an evaluation on an hourly basis.
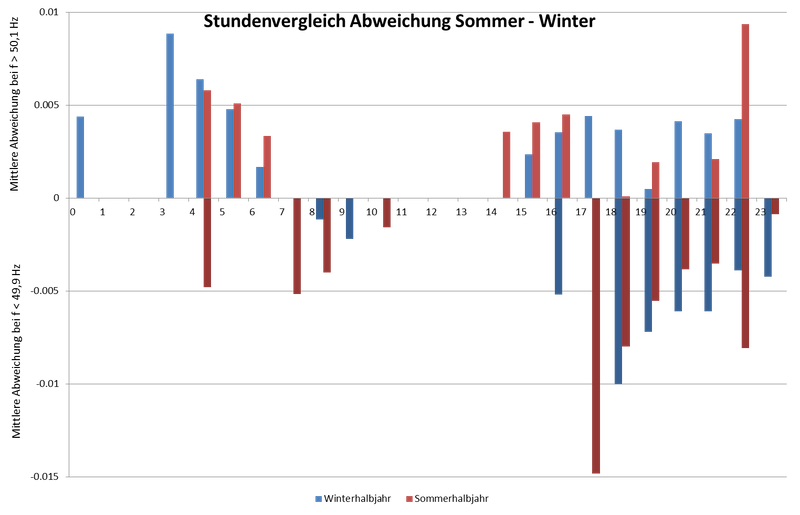
Figure shows hourly mean deviation greater than 100 mHz in positive and negative directions. Blue shaded bars show the deviations in the winter half-year, red shaded bars show the deviation in the summer half-year.
In general, two time periods can be identified when deviations occur particularly frequently: In the morning hours, rather in positive direction, and in the evening hours, with stronger swings in negative direction (except at 22:00). Obviously, deviations are particularly strong when power plants are ramped up or down at the change of hours. When shutting down in the evening hours, the effect tends to be more pronounced in the winter months. One potential explanation could be that more conventional power plants are connected to the grid in the winter months. The balancing effect by renewables across the hourly break (cf. Stabilization by RE), appears to be weaker during this period.
Findings and conclusions from the observations.
The preceding descriptive analysis supports and deepens the findings from the BWK article. In general, the results show that frequency deviations are subject to systematic fluctuations, contrary to what is generally assumed. Fluctuations are particularly pronounced around the hourly break, with a tendency toward a positive direction in the morning hours and a tendency toward a negative direction in the evening hours, which is probably driven by requirements of exchange products.
These observations cast doubt on current bidding practices for balancing power and the financing of balancing power reserve and call:
- There is a need for shorter-term control power products that do not necessarily have to be offered on a time-slice basis, but can be called on short notice.
- Tender volumes should be based on times of day, not necessarily on quarters or usage requirements in previous quarters.
- A product should be created that can be provided very quickly in high power positive and/or negative and can be switched off again just as quickly, such as batteries, distributed data centers or cooling units.
- Due to the clear allocation of frequency deviations to the hourly break, a causer-based financing of the provision or at least the call-off would be required precisely when the control power demand can be allocated to a clear cause.
Status 20.05.2019