Interconnector trip FR - UK
On 01.09.2023, at around 09:17 (UTC), there was an unexpected reduction in exports from France to the UK of approximately 1000 MW according to Transparency ENTSO-E. This roughly corresponds to the output of a small to medium-sized nuclear power plant and thus to around 30 per cent of the net import and around 3 per cent of the consumption of Great Britain at that time. As was the case with the outage of the NSL interconnector on 08 June 2023, this again shows how significant the connections to the neighbouring synchronous areas are for the UK.
Consequences and countermeasures
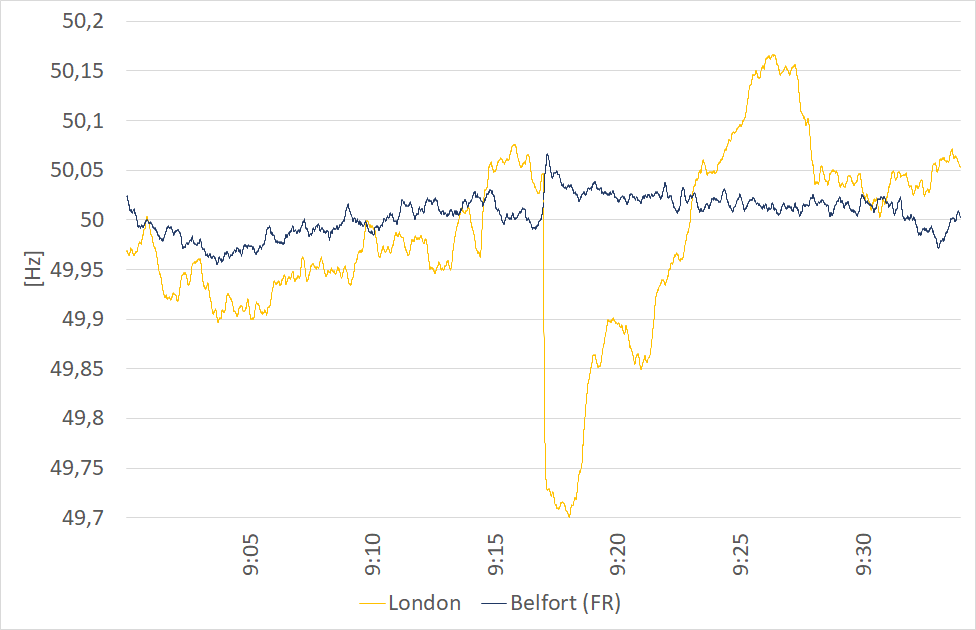
Figure 1: Frequency Comparison UCTE - UKTSOA
Figure 1 shows the frequency jumps that the power interruption triggered: In the UK, frequency dropped by an average of around 350 mHz. In the UTCE area, the loss of interconnector power was also noticeable. However, the frequency increase was much weaker at around 50 mHz.
A closer look at the frequency jumps at the time of the outage (Figure 2) illustrates the known effects of proximity to the outage: measuring stations closer to the outage site show stronger reactions than those further away from the outage site. However, the synchronisation of the frequency drop in London and Manchester at the time of the event is striking. This indicates that the grid situation in the UK was largely balanced at the time of the outage (compared, for example, to the time of the NSL outage on 08 June 2023).
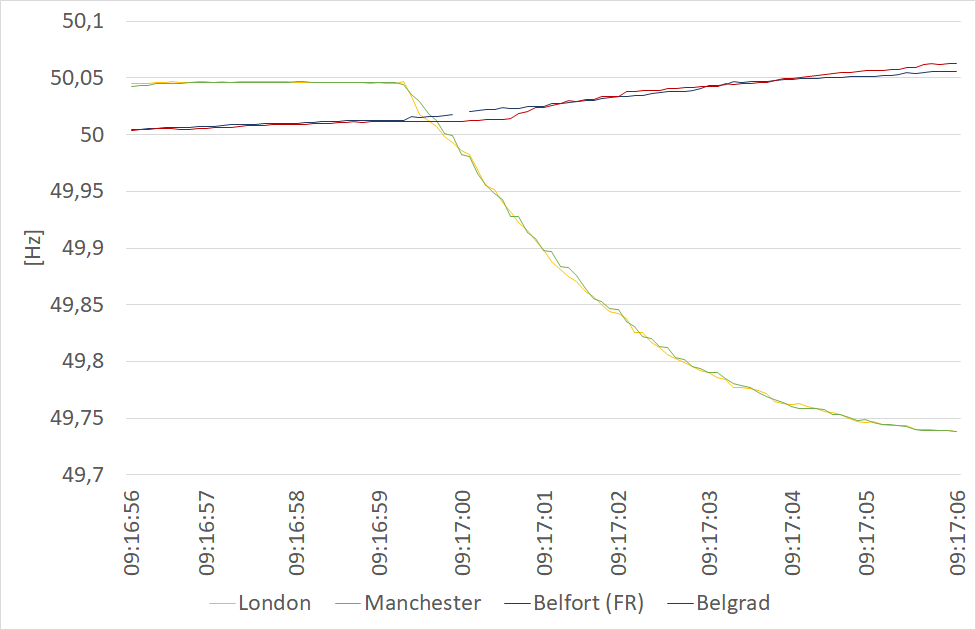
Figure 2: Local frequency comparison
Further analysis makes it clear that the UK was very lucky with the timing of the outage: the interconnector outage happened virtually after the morning ramp on a day with quite a lot of conventional generation when solar radiation was just increasing massively. At the time of the outage, solar and wind accounted for about 16 per cent of the UK's electricity mix. Most of the generation was from natural gas (about 58 per cent) and nuclear (about 19 per cent). The rapid increase in solar radiation meant that about 473 MW (= 53 per cent) of the interconnector loss could be replaced by solar energy within 25 minutes, as Figure 3 shows. The remaining loss was replaced mainly by an increase in generation from natural gas.
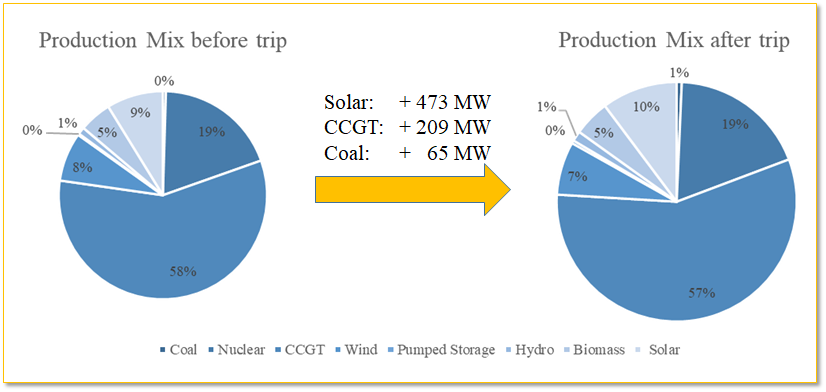
Figure 3: Generation adjustment as a result of the interconnector outage
Regional impact
For the regional analysis, we compare the phase angle difference of measuring stations that are differently close to the location of the outage with those that are affected as little as possible by the effect due to their spatial distance, but are still in the same synchronous area. As Figure 2 shows, the comparison at this point in time is difficult for Great Britain because the system is largely balanced and thus effects in the system spread very quickly. This means that even a location further away will be affected quickly and to a similar extent as measuring stations allocated closer to the location of the event. Therefore, the following consideration shows a very conservative representation for the situation in Great Britain.
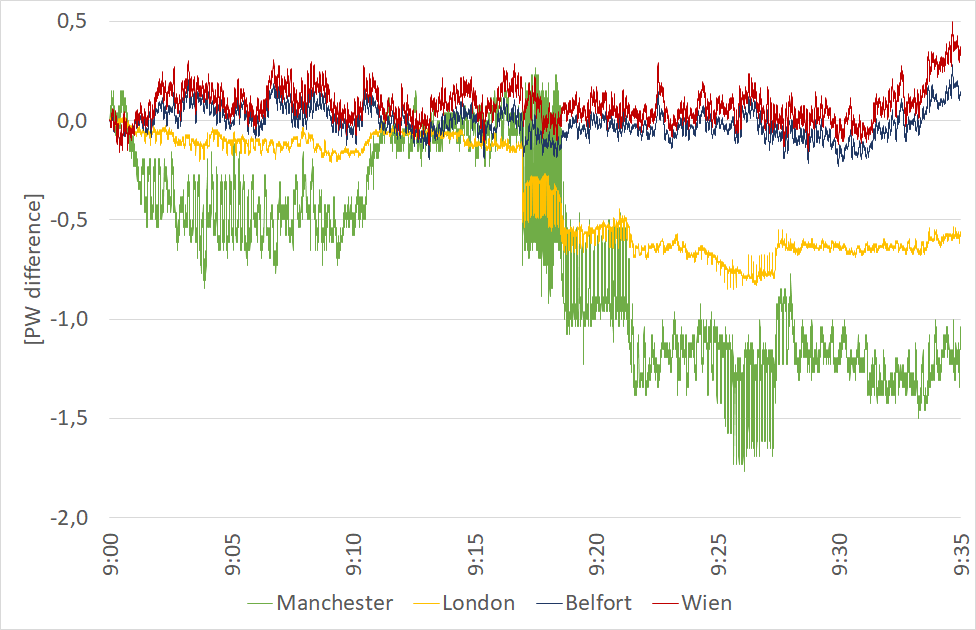
Figure 4: Regional impact of the interconnector trip
In the following, we look at the phase angle differences of London and Manchester in comparison with Strathclyde as well as the phase angle differences of Belfort and Vienna in comparison with Crete. While Belfort and Vienna are virtually unaffected by the outage, there are very strong fluctuations in the phase angle difference of London and especially Manchester (Figure 4).
A closer look around the point of failure in Figure 5 illustrates that not only are the fluctuations in Manchester much greater, but also the overall effect is more pronounced in Manchester than in London. It should be noted that London is almost 300 km closer to the point of failure than Manchester. The
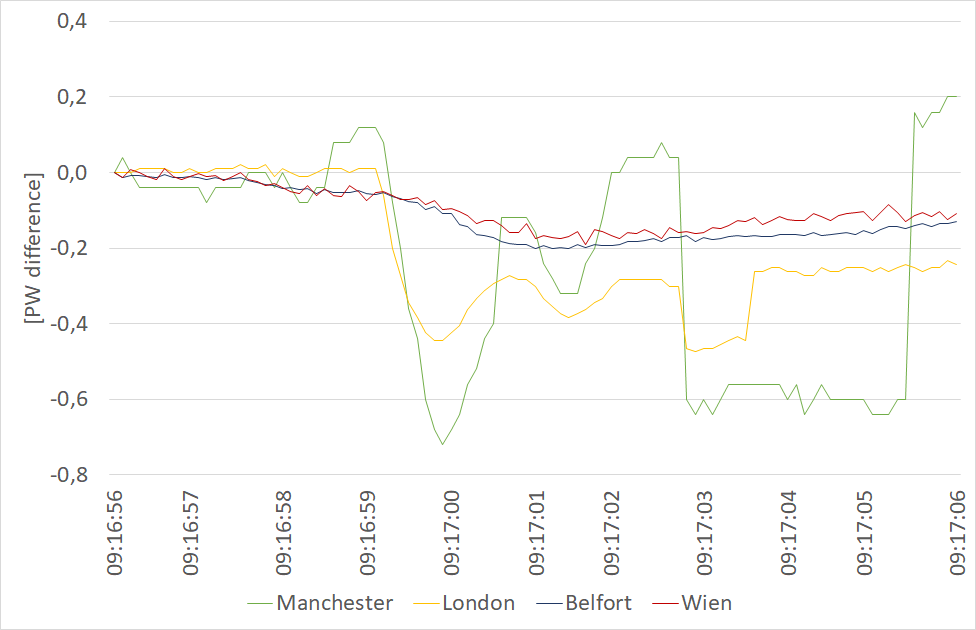
Figure 5: The interconnector trip in the local view
The lower impact in the London region suggests that the large number of generating gas-fired power plants in south-east England with their flywheels mitigated the effect, while the coal-fired power plants in central England were largely not connected to the grid and thus could not contribute to mitigating the effect.
Summary
It remains to be said that especially smaller synchronous areas, such as in the current case of Great Britain, depend significantly on the functionality of interconnectors. On the one hand, these contribute significantly to system stabilisation and enable the energy exchange and balancing between synchronous areas. This is definitely desirable from an energy technology and market point of view and is also supported by the current efforts of market integration from a technical and market point of view. On the other hand, opportunities arise for market players and traders if they are informed about events on the interconnectors at short notice and can react. At the time of this publication (4 days after the outage), unfortunately, the unexpected outage of the interconnector has still not appeared on Transparency ENTSO-E. The missing power was first announced on the official UK pages and then (by the hour) on Transparency ENTSO-E. Especially for fast-acting market players, the information advantage results in potentials both in intraday and in the area of system services. The current interconnector outage as well as the NSL outage show that from our measurements on both sides of interconnectors this information can be provided within milliseconds.