Don't stop a running interconnector
On 08 June 2023, at 10:39 UTC, there was an unexpected disconnection of the North Sea Link (NSL) interconnector (https://en.wikipedia.org/wiki/North_Sea_Link), which was connected to the grid in 2021. This 1400 MW single circuit interconnector connects the two synchronous areas UKTSOA on the British main island and Nordic with a length of 720 km. At the time of the disconnection, 1290 MW were transported from Scandinavia to the UK. This is roughly equivalent to the output of one unit at the former German nuclear power plant Gundremmingen.
Consequences of the split
The separation led to an abrupt frequency change in both synchronous areas, as Figure 1 shows. In Scandinavia, there was a positive frequency jump of almost 0.4 Hz. In Great Britain, the frequency even jumped by 0.5 Hz.
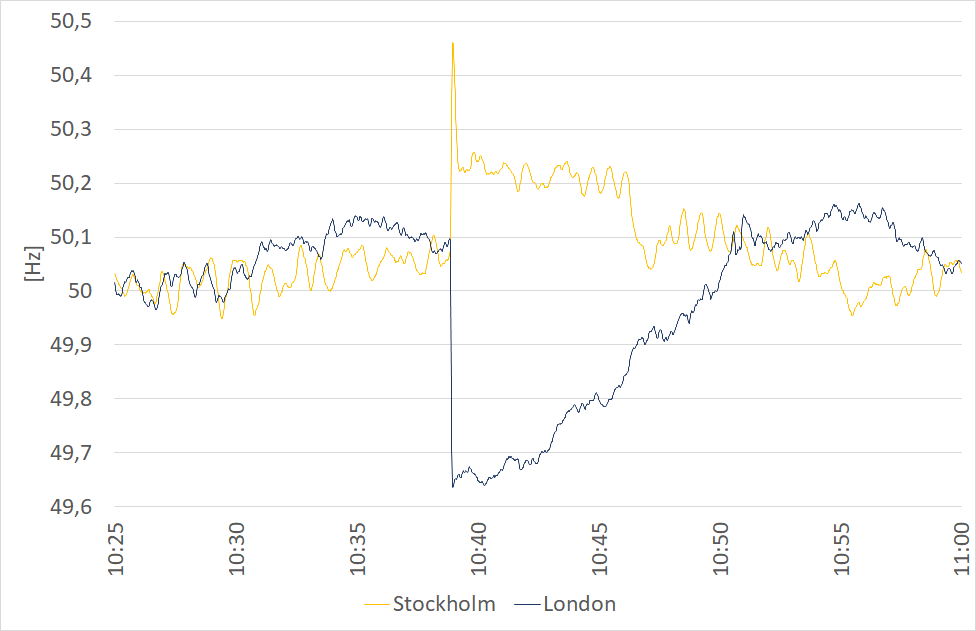
Figure 1: Comparison frequencies Nordics and UKTSOA
If one zooms into the area of the frequency jump, two significant effects become apparent (Figure 2): In the region before the interconnector, there was a two‐stage increase in frequency. The closer one measures to the interconnector, the stronger the wave (cf. Aas in Norway and Stockholm in Sweden). This indicates that the flow over the interconnector was interrupted due to the disturbance at 10:38:52, but a possible backflow occurred.
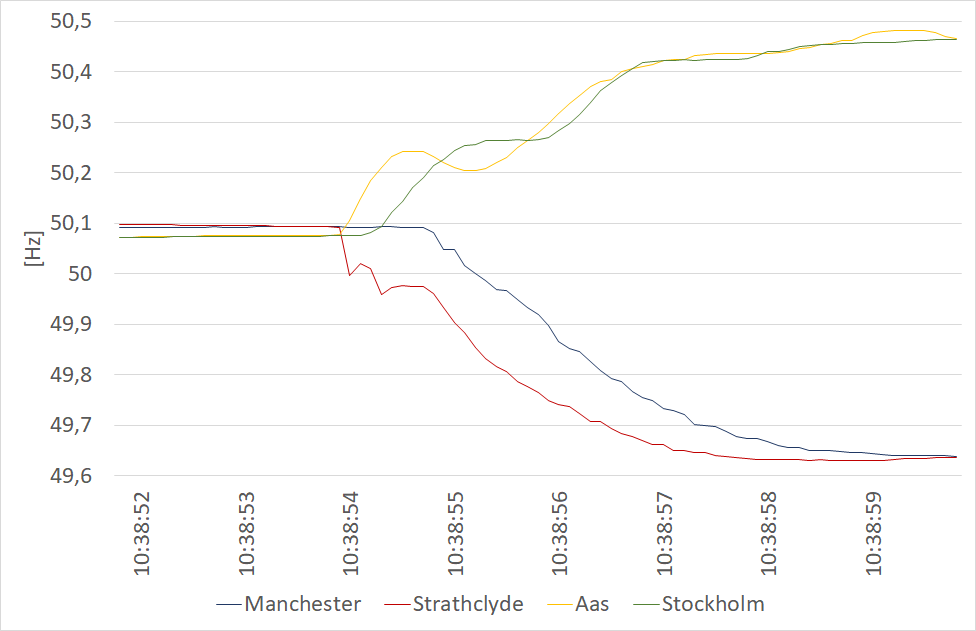
Figure 2: Detailed consideration of the frequencies
More interesting is the effect on the back side of the interconnector: Manchester and Stratchclyde, the locations of the nearest grid radar measuring stations are approximately equidistant from Blyth, the UK NSL charging point. At Strathclyde, frequency sagging can already be observed with the first dursack at 10:38:52. This dip stabilises briefly before the frequency then fully collapses at Stratchclyde. In Manchester, on the other hand, the first disruption had no effect on frequency at all. This massive drifting apart in the British synchronous area is remarkable. Because the frequency here shows a short‐term difference of around 130 mHz over a distance of around 330 km.
The region around Manchester has traditionally been heavily industrialised. Apparently, the demand‐ side flywheels and conventional power plants in the region acted as a momentary reserve and slowed down the first drop in frequency. This has had a mitigating effect on the grid frequency in both the British synchronous area and the Scandinavian synchronous area. This may also be the reason for the two‐stage drop in frequency. This is because the second event is reflected in both the Strathclyde and the Aas frequency response shortly after the subsidence in the Manchester region.
When the oscillating masses could no longer stabilise the system sufficiently, the frequency in the British synchronous region sagged further. This observation points to the inherent importance of the Manchester region for the stability of the UK synchronous region.
Consideration of the phase angle difference
The phase angle difference enables a comparison of the net feed‐in between two different points in a grid. If this difference is negative, in simple terms there is a current flow from the first to the second measuring point and vice versa. Figure 3 compares the current flows in the Scandinavian and the British synchronous grid areas.
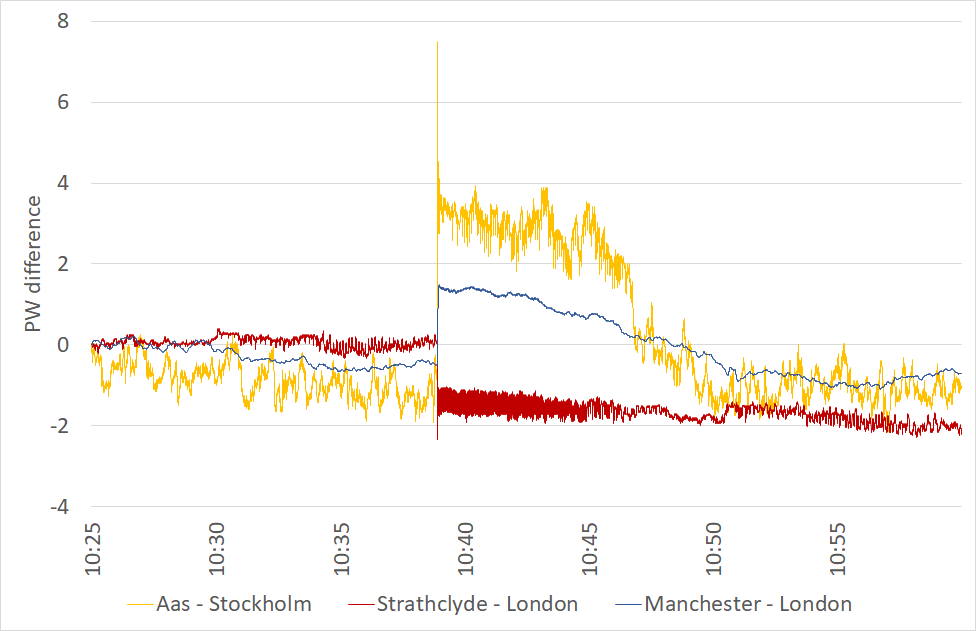
Figure 3: Development of the phasor angle differences
The yellow curve shows the current flow between Stockholm and Aas near Oslo. The Scandinavian landing point of the NSL, Kvilldal, lies in the western extension of these two measuring points. We first see a constant ratio of measurements between Stockholm and Aas. The disconnection of the interconnector then causes an almost vertical jump in the phase angle difference. This is due to the fact that with the occurrence of the line outage, there is much more energy in the system close to the interconnector than in regions further away from the interconnector. As a result of the grid disconnection, the excess energy in the grid is then reduced by appropriate countermeasures. In all bidding zones of the synchronous area, negative aFRR totalling 328.3 MW was activated in the corresponding time and another 199.9 MW in the following hour. However, the shortfall as a result of the lack of import performance paints a very divergent picture: As expected, in the UK the disconnection of the interconnector (on import) should lead to a reaction of the angle difference in the opposite direction to the Scandinavian system. To analyse this process in the UK grid, we use the phase angle difference from Strathclyde and Manchester to London. Due to the loss of the imported power of 1290 MW, there is a shortfall of power in the British system. As a result, the phase angle difference to London drops abruptly in the region around Strathclyde. On the other hand, it rises sharply in the region around Manchester. Manchester and its surrounding area form a centre of British industry. It can be assumed that the vector jump or the underfrequency near 49.6 Hz as a result of the disconnection of the interconnector has led to an automated load shedding in this region. It is also noticeable that the frequency in the British system dropped by approx. 500 mHz, but the Scandinavian system showed a somewhat smaller jump of "only" 400 Mhz. This speaks for a lower network runtime of the British system compared to the Scandinavian interconnected network.
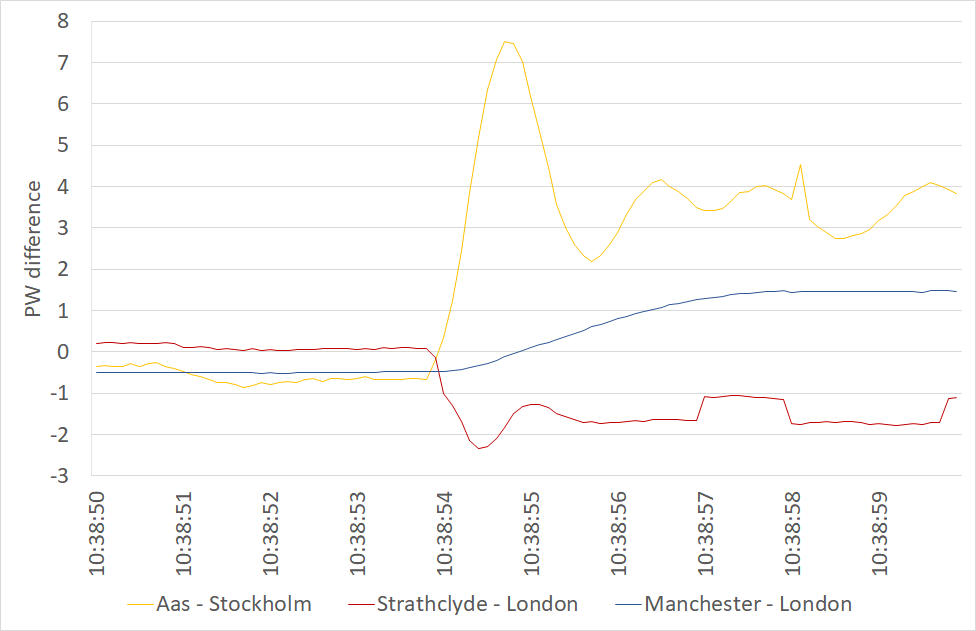
Figure 4: Detailed view of the phasor angle differences
This is also shown in Figure 4 when zooming in closer to the area around the event: The phase angle differences in Aas and in Strathclyde show the typical strong swing after a grid split (cf. e.g. the split from Spain in 2021). This is followed by the classic short countermovement and then a phase of quasi‐stationarity at the new level. In Manchester, on the other hand, one sees a steady increase in the phase angle difference, which indicates a controlled counteraction in response to the power drop.