08/01/2021, 17/05/2021, 18/05/2021
Introduction
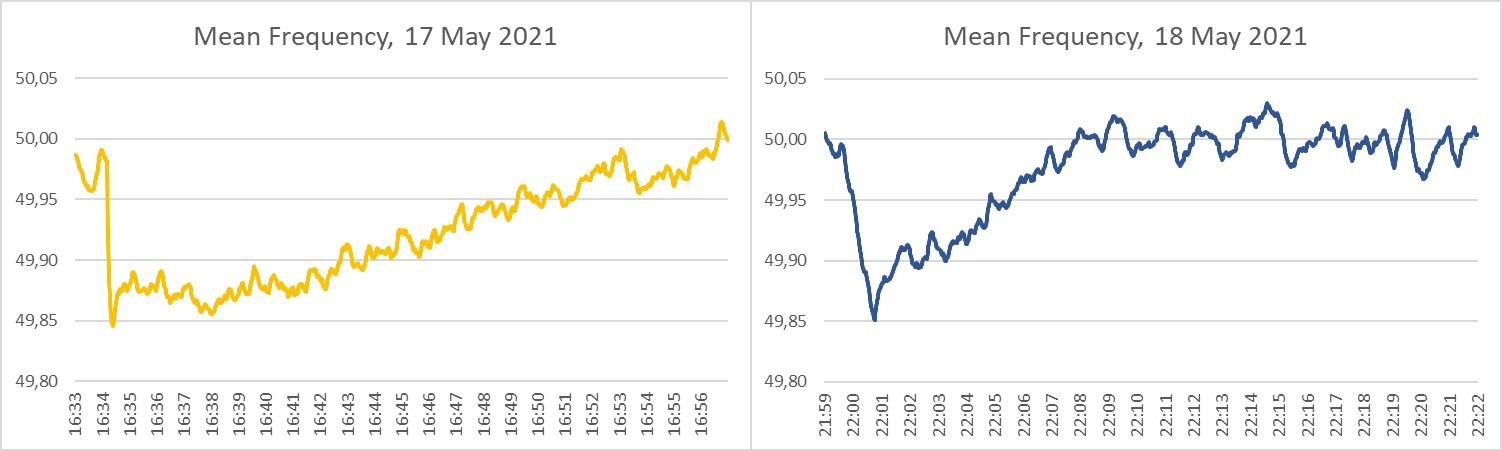
08/01/2021, 17/05/2021, 18/05/2021 ‐ these are the dates when the grid frequency fell below 49.85 mHz this year. As a reminder, the last time this happened was on 23/07/2020 and before that in January and April 2019. Such events do happen. However, they have been occurring more frequently recently.
Let us take a closer look at the events of 17/05/2021 and 18/05/2021.
Shutdown of the Rogowiec substation
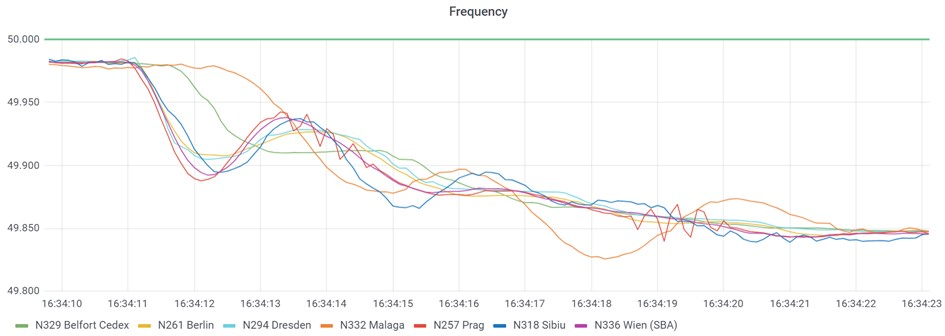
According to the press release of the power plant operator PGE GiEK and the publication of ENTSO‐E, the massive frequency drop on 17/05 is due to a disconnection of the substation in Rogowiec in Poland at 16:34 (UTC). As a result, the nine units of the Belchatów lignite‐fired power plant with a total capacity of 3460 MW disconnected from the grid. (PGE GiEK-Press Release and ENTSO-E-Post).
The frequency curve at the time of the shutdown clearly shows how the event developed in waves over Europe. On the one hand, the slope of the drop decreases away from the starting point. On the other hand, the first sag also decreases away from the location of the event. At our measuring station in Málaga, it is no longer present at all.
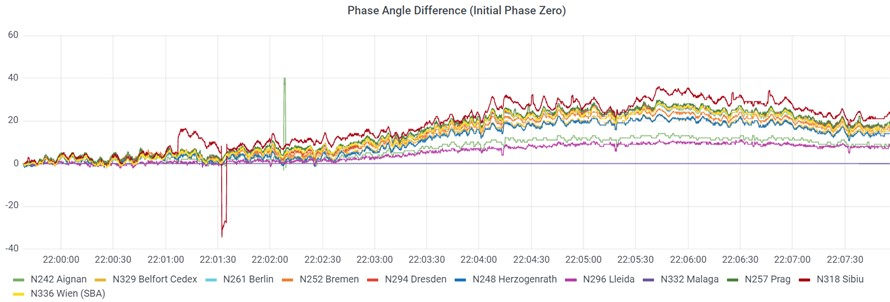
In this context, it should be noted that this event exceeded the design case of the primary control reserve to be maintained in Europe of 3000 MW (Operational Handbook Policy 1). However, the frequency drop was ultimately stopped by the countermeasures in Poland itself and the system was stabilised again. The return of the system to the range of the frequency deadband (50 Hz +/‐ 20 mHz) ultimately took about 20 minutes. The following figure shows the phase angle difference to the measuring station in Málaga. This measuring station is furthest away from the location of the event and thus least affected by the event. The phase angle differences of the measuring stations are shown as an index with the same starting value 0. This makes it possible to roughly compare differences in terms of net input around the locations of the measuring stations. At the time of the event at 16:34 (UTC), the already identified divergence occurred. A clear east‐west split can be seen: The power drop caused by the power plant hit eastern regions harder. Bremen and Sibiu are at a similar distance from Belchatów, 815 and 850 km respectively. However, the drop in output is almost 40 percent more pronounced in Sibiu.
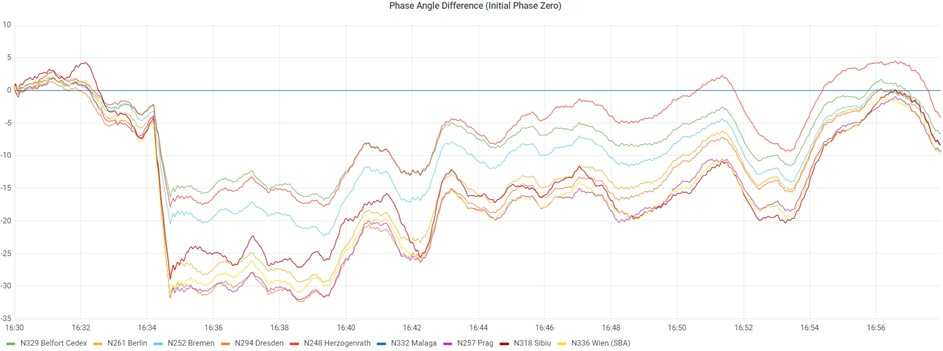
The phase angle difference graph indicates that the western power plants in particular have supported the system and have contributed significantly to the return of the UCTE grid interconnection to the regulator dead band.
Frequency drop at hour break
The following figure shows the start of the frequency drop on 18/05. The observation window corresponds to the period shown above. It is clearly visible that the frequency drop is not due to a specific event. Rather, this is the typical course at the beginning of the frequency drop in the course of the hourly break.
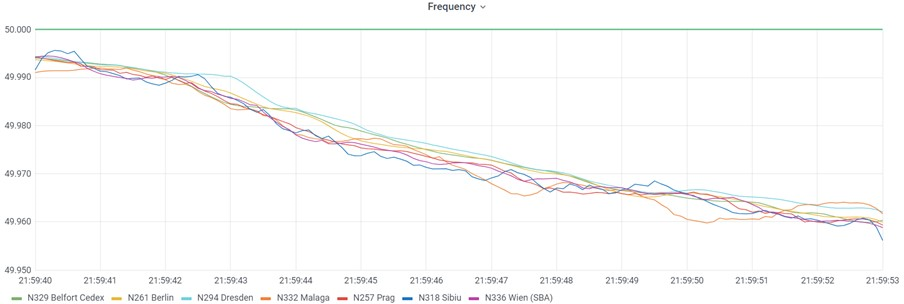
Overall, the drop in grid frequency lasted over a minute until the minimum was reached (in contrast to 20 seconds for the 17/05 event). The primary control power kicked in after about 10 seconds, whereby it only had a minor effect and only slight differences between the regions can be seen here. Only the measuring station in Spain shows a slightly longer sag. The total event from the start to the return of the frequency to the controller deadband lasted just under seven minutes.
Let us also look here at the phase angle difference in relation to the measuring station in Málaga.
For this event, the curves of the other measuring stations are almost consistently above the 0-line. There is also an East‐West gradient, but in the opposite direction. Measuring stations in South‐Western Europe show a smaller (positive) deviation than those further East and South‐East. This means that a power deficit probably prevailed in Spain during this event. This is because the courses of Málaga in southern Spain and Lleida in northern Spain as well as Aignan in southern France are initially relatively close. However, in the frequency return phase, the phase angle differences move lower and also with a lower slope than those of the other regions. This means that the necessary power for the return of the system towards 50 Hz was mainly called up by the transmission system operators of the other control areas.
Individual case or systemic course?
Can the differences between the two events be explained by the cause of the events or by systemic conditions?
We probably have to answer the question in two parts. In the first case, the frequency collapse on 17/05, there was a clear, localisable cause ‐ the failure of the Polish substation. In the second case, it was an exceptionally strong market‐driven event. If we first look at the drop in frequency, we can clearly see that the 17/05 event was causally technical in nature. As a result, the slope of the frequency drop was much steeper. At the same time, the instantaneous reserve in the grid had a direct counteracting effect and the primary control reserve counteracted as intended, even if it was not sufficient. The 18/05 event was a market‐driven event. As already shown in the article Long-Term Analysis of Grid Frequency Proves Renewables Damping Effect on the Grid, trading effects occur mainly around the hourly break and lead to a drop in frequency especially in the evening hours. Since the frequency drop on 18/05 was not steep but continuous, the dampening effect of the instantaneous reserve is practically not visible in the frequency curve (although it certainly slowed down the drop). The small effect of the primary control reserve can be explained by the fact that at the time of the necessary call‐up, power plants were shutting down or new ones were starting up. As often rumored in the energy sector, the primary control of the turbine set is often disabled in this phase. This deactivation of primary control power or the short‐term change in the controller statics serves to be able to start up certain contractually agreed outputs without primary control intervening in a disruptive manner. As a result, some power plants were not available to the grid system for balancing.
The return of the system to the range of the frequency deadband took place at two different times.
Conclusion
The two events point to two main issues:
-
There are obviously different effects on our energy system, which are identical in their effect on the frequency deviation, but take a completely different course. While the 17/05 event can be classified in the category of stochastic frequency drops, the frequency drop on 18/05 was deterministic. Deterministic, because trading artefacts at this time are known. Consequently, the first event could not have been foreseen by market participants. Rather, the mechanisms provided for worked well in the usual way. The 18/05 event shows that other countermeasures are possible. Power plants follow market signals in their operation. Such an event could be prevented by adapting product definitions or by developing new event‐driven products.
-
In general, we cannot speak of an East‐West difference in the system regulation. On 17/05, in our view, it was clearly the Western European regions that had supported the system. On 18/05 it was the Western and Eastern European regions that intervened together. However, it is important to understand the system regulation as a joint task. Therefore, the question of socialising the costs naturally arises. Transmission system operators are responsible for balancing their control area. The German transmission system operators do this jointly. This means that costs for the use of balancing energy are incurred nationally in each case. However, if the cause of an event with a pan‐European effect can be clearly identified, the costs should be allocated accordingly and not socialised nationally. The same applies accordingly if certain transmission system operators explicitly step into the breach during a major event in order to save the entire system, such as the French and Italian transmission system operators RTE and Terna with their load shedding during the grid split on 08/01/2021 (Continental-European grid frequency drops below 49.75 Hz – system split ensues).
The comparison of the two events clearly shows that our transmission system operators are doing an excellent job, even in the current very volatile period. It therefore seems important that the market side can also have a stronger supporting effect. This would require corresponding products or more flexibility in the design of the products. This is because the causes of frequency drops can be classified and costs allocated accordingly according to the polluter‐pays principle.
However, this also presupposes that not only the system‐technical side represented by the transmission system operators cooperates across Europe. Rather, this must also be followed up in the market design for system efficiency.