Load Shedding in South Africa
At the beginning of 2023, the number of references in serious German media regarding the critical energy supply situation in South Africa (e.g. Süddeutsche, 17.01.2023, Tagesschau, 09.02.2023, Frankfurter Allgemeine Zeitung, 13.02.2023) is increasing. The challenges in South Africa have also been highlighted in the global press since the end of 2022 at the latest. There have been repeated reports of prolonged power outages in urban centers such as Johannesburg, Cape Town and Pretoria, in some cases lasting up to 11 hours.
We take these articles as an opportunity to discuss the availability situation in South Africa during the last year here. For this purpose, we use data from our measuring station in Stellenbosch, east of Cape Town. We are aware that this observation can only depict one region. Nevertheless, we are convinced that these data offer a bit more insight into the actual situation in South Africa.
Regulation and the quasi-monopolist Eskom
The South African grid differs in key respects from that in Europe. Like Germany, South Africa is part of an interconnected system, the South African Power Pool (SAPP). Unlike in continental Europe, however, there are only a few parallel interconnectors in this interconnected system. South Africa's transmission system connects large urban centers directly to the major generation centers in the northeast and southwest (see the following map). At the same time, less stringent grid security and stability requirements exist in South Africa. Less regulatory pressure leads to a lack of stringency in frequency maintenance.
The South African energy supplier Eskom, a state-owned quasi-monopolist and until recently a fully vertically integrated interconnected company, has been carrying out rolling load shedding for some time now. In this so-called load shedding, entire regions and metropolitan areas in Cape Town, Pretoria or Johannesburg are disconnected from the power supply with prior notice, sometimes for hours at a time. This was necessary because Eskom cannot continuously generate enough energy to cover the load.
South Africa's power plant fleet, which is based on coal generation, is around 40 years old. In the meantime, power plant units regularly fail because necessary re-investments and replacements were not made, especially under the government of the previous president Zuma (2009-2018). According to Eskom manager Jan Oberholzer, power plants still available have to generate at their capacity limits to replace power plants in emergency shutdown (see Le Monde, September 23, 2022).
Analysis data
Like the European grid, the South African grid is operated at 50 Hertz. The following comparison from January 3-Wednesday 12:00 to 12:05 (UTC) shows that the grid frequency in South Africa fluctuates much more than in continental Europe or even in smaller grids such as the UK or Scandinavia (Figure 1).
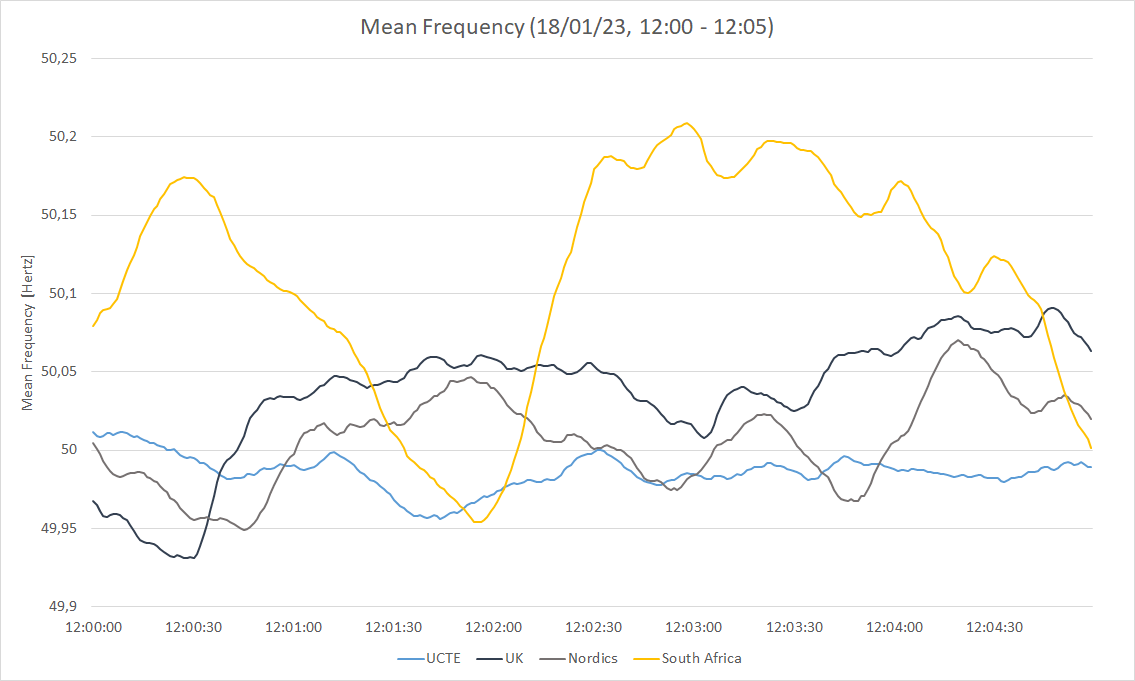
Figure 1: Comparison Frequency Development
The mean fluctuation range expressed as standard deviation per hertz was 0.24 percent in January 2023. By comparison, in continental Europe it was 0.04 percent in the same period.
The measurement data were recorded by Gridradar's own measurement station in Stellenbosch. It was commissioned in April 2022 and measures the grid frequency at a sampling rate of 10 measurements per second.
Long-term analysis of the default situation
In the period between April 17, 2022 and February 10, 2023, there were 539 outages longer than 1 minute. The average outage duration of these power outages was 19.42 minutes, with a maximum of just under an hour. Figure 2 shows the outage duration in minutes per hour during the observation period.
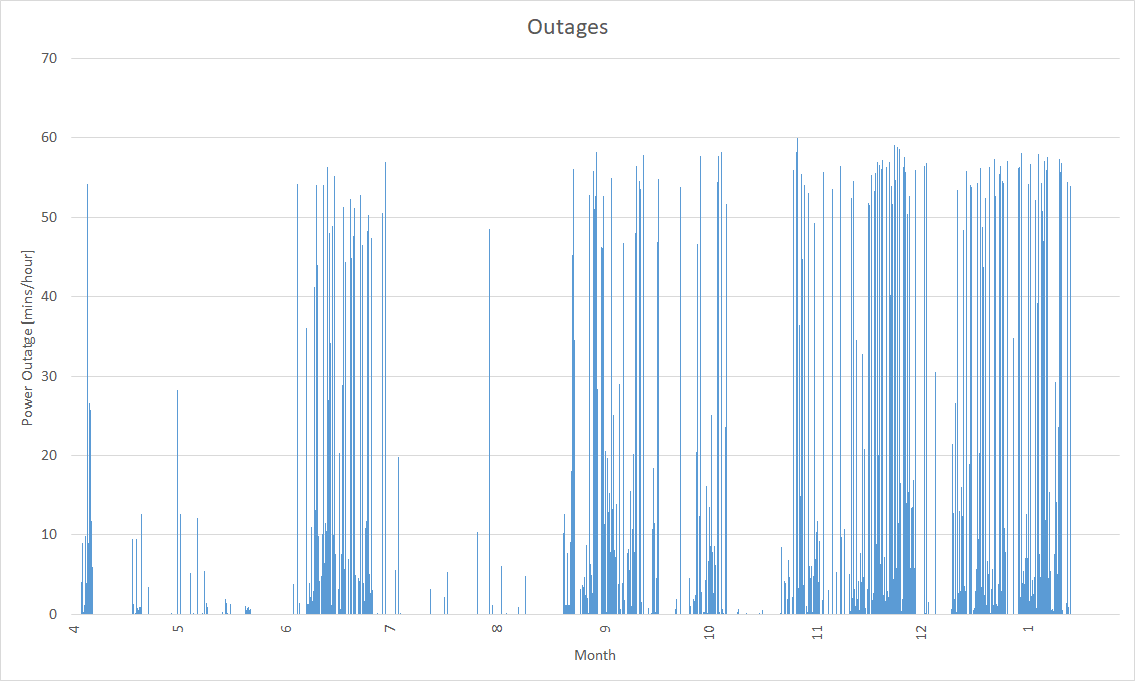
Figure 2: Duration of Power Outages
Three periods can be identified in which power outages were particularly concentrated: from mid- June to mid-July, from early September to the second half of October, and then from early November. The power outages do not follow consistent patterns. Eskom does specify windows of supply interruption in advance. However, the public and businesses cannot plan interruptions based on this: rather, duration and time windows shift within and beyond the announced periods.
Further analysis of the data shows that it is not only longer-lasting power outages that occur. We also repeatedly register series of short interruptions within individual hours. In hours with outages, more than 6 separate interruptions take place on average. At the peak, we registered 34 interruptions within one hour. The large number of such short interruptions particularly affects power-dependent industries and high-tech/IT service providers: motors of electrical machines require a start-up time until they are at operating speed. Only then can they be used. If frequent start-ups and abrupt unplanned stops occur in short succession, electrical machines wear out all the faster. Such unplanned short interruptions are even worse for servers without battery buffers or compute- intensive processes. Companies cannot produce with such unplannability. Therefore, unplannability has a long-term impact on the development of industry and thus on economic growth in South Africa.
Weekly and daily evaluation
Figure 3 shows the number (blue) and total length (yellow) of outages per week.
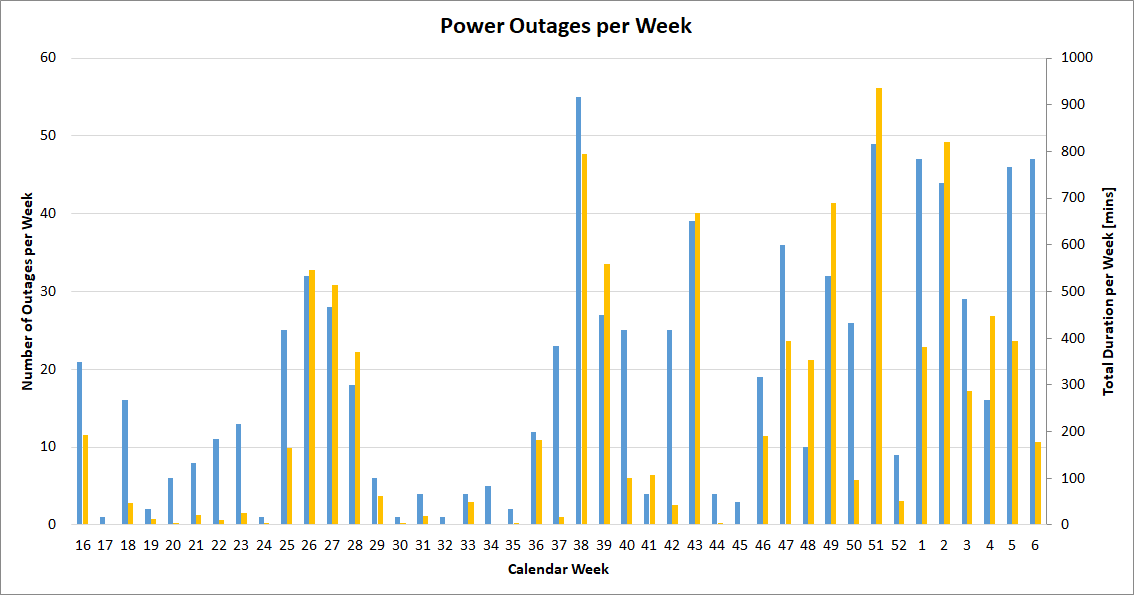
Figure 3: Comparison of Power Outages per Calendar Week
In weeks with a particularly high number of outages, the outage duration is higher overall. Exceptions to this are the periods between calendar weeks 20 and 23 2022 and calendar weeks 5 and 6 2023. In these periods, there was a particular accumulation of the aforementioned critical short interruptions.
The analysis of individual days of the week in Figure 4 also does not reveal any classic consumption-driven patterns of outages.
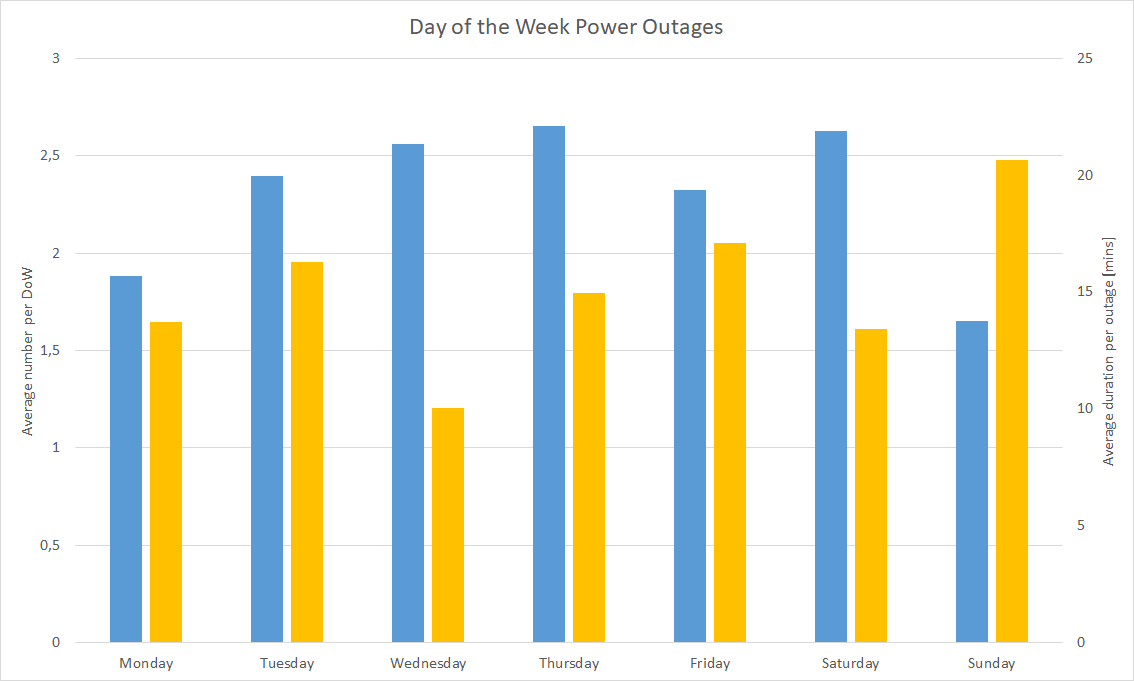
Figure 4: Comparison of Power Outages per Weekday
Consumption-driven patterns would be expected if generation did not keep up with increased demand for energy. Over the week, days with more power outages on average (blue) appear to have shorter outages (yellow) and vice versa.
Another challenge for consumers is that load shedding ignores critical hours of the day. If we add the hours to the daily view, no consistent patterns can be identified over the course of the day either (Figure 5).
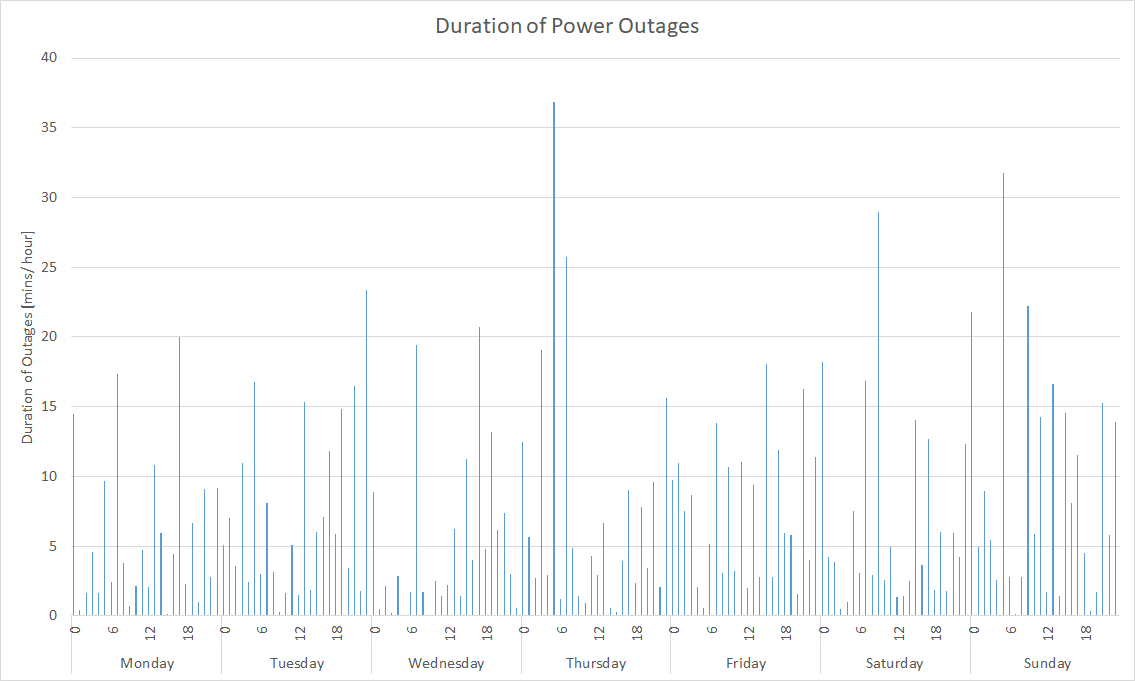
Figure 5: Duration of Power Outages per Hour of the Day
Renewables as a way out?
The South African Department of Energy as well as public investors have been trying to create more competition by expanding renewables since the middle of the last decade. Through the involvement of foreign, public and private investors as Independent Power Producers (IPPs), around 10 GW of new capacity was installed between 2010 and 2019. Nevertheless, coal generation still predominates, accounting for about 90 percent of total power generation.
At the end of 2020, Acting President Cyril Ramaphosa appointed the Climate Commission PCC, among other things to accelerate the expansion of renewables. According to tagesschau.de, renewable generation is to dominate by 2050. To achieve this, around 150 GW of wind and PV plants would have to be added within 25 years, i.e. around 6 GW per year.
Another challenge in the transition is that Eskom must be involved as a central partner in the provision of energy from new plants. A so-called Purchase Power Agreement (PPA) must be concluded between an IPP and Eskom. Through this agreement, Eskom initially purchases the IPP's power and then resells it. This puts Eskom in a privileged competitive position. In order for competition to develop adequately, on the other hand, Eskom would need to be understood as competing on an equal footing with IPPs. However, due to its existing generation capacity, Eskom would still have a competitive advantage even then.
The comparison of Germany with South Africa is lame
Some media are using the example of South Africa to highlight the growing potential of power outages in Germany today. However, a clear distinction must be made between two completely different situations:
- Germany is at the center of the largest interconnected system in the world, the UCTE area, with more than 500 million connected consumers. South Africa is part of the SAPP, also an interconnected system, with over 76 percent of total consumption. The German transmission system has distributed large generation centers and is highly intermeshed. The South African supply system is characterized by large generation centers in the northwest and southeast and individual, non-meshed transmission system routes to large consumption centers over long distances.
- The current situation in South Africa is due to several long-term evolving structural problems. Eskom was until recently a fully vertically integrated energy monopolist, with power generation, transmission and distribution combined in one state-controlled company. Tight government and political entanglements coupled with corruption and a lack of strategic development of the company resulted in inadequate infrastructure investment in all three of the company's sub-sectors. Eskom itself has unsuccessfully emphasized the need for these investments to the Zuma government. The generation infrastructure in South Africa is largely over 40 years old, according to indications from the Chief Operational Officer in Le Monde 2021. Lack of maintenance and re-investment are currently leading to massive outages of individual power plant units. On the one hand, the lack of generation capacity is compensated for by increased use of other power plant units up to their limits. On the other hand, load shedding is necessary because consumption can no longer be covered.
- European regulation and competition policy is regarded worldwide as a model in the separation of market and network. On the one hand, this ensures adequate competition in generation and, at the same time, calls for a strict separation between companies operating competitively and the necessary monopolies in the grid area and thus in system management. In Europe, the separation between generation and network was completed by 2009 at the latest with the third regulatory package. Corresponding steps were not taken in South Africa with regard to Eskom until the end of 2021 with the separation of the generation and transmission business areas. The separation of the distribution networks followed in December 2022 (Reuters, 2021).
Conclusion
Our analyses indicate a large number of supply interruptions in South Africa due to load shedding. Contrary to repeated anecdotal reports in the press on the basis of individual cases, these are not (only) long-lasting outages. Unplannable, brief interruptions in supply dominate, with short periods of availability being restored in the meantime. This difference is particularly critical for more complex generation processes and the development of high-tech companies or IT-based service providers in South Africa.
According to publications from various sources, the load shedding that is now necessary in South Africa can be attributed to strategic failures in the past that do not occur in this form in Europe or Germany. Germany is protected in the center of the Continental European interconnected system by reliable cooperation with neighboring countries. Large-scale planned blackouts (as a means of load reduction), as in South Africa, are not necessary in the currently foreseeable situation in Germany.
What can happen in Germany (as in any country) are unexpected power outages or power outages as a result of deliberate manipulation. Grid operators and generators are currently making the best possible preparations for this. Under normal conditions (no war situation), planned shutdowns can occur in Germany if the supply-dependent generation problem of renewables is not adequately addressed in the foreseeable future by storage solutions in combination with sector coupling (inside and outside Germany).